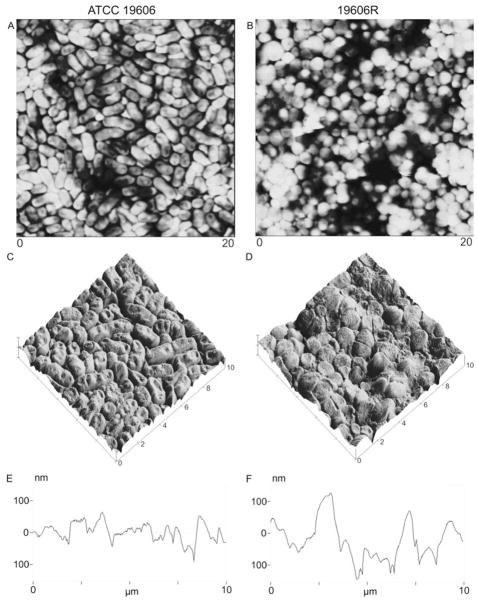
Figure 3.
AFM images of bacterial lawns prepared with ATCC 19606 (panels A, C and E) and 19606R (panels B, D and F) at mid-logarithmic phase treated with 32 mgL−1 colistin, presented as: (i) 20 × 20 μm height images (panels A and B); (ii) magnified 10 × 10 μm surface plots, constructed from height images (panels C and D); and, (iii) cross-sections of the 10 × 10 μm surface plots (panels E and F).

