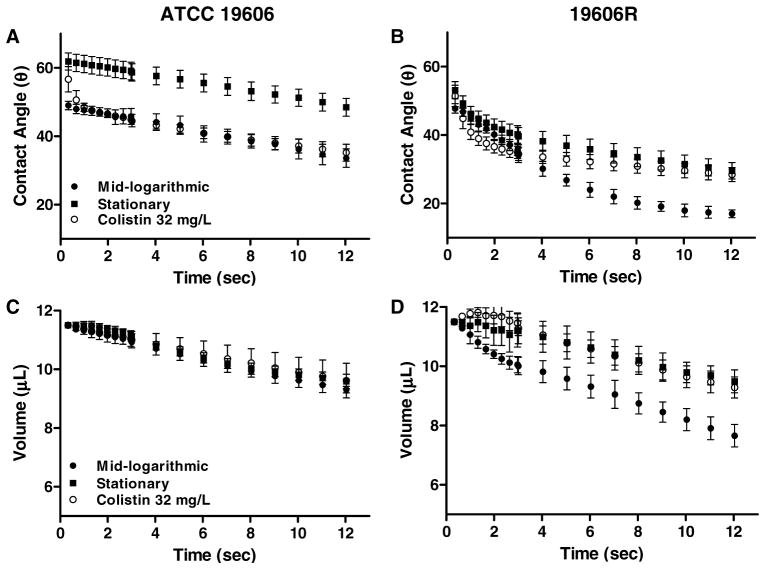
Figure 5.
Change in contact angle (panels A and B, mean ± SD) and droplet volume (panels C and D, mean ± SD) illustrated as a function of time over ~12 sec for ATCC 19606 (panels A and C) and 19606R (panels B and D) at mid-logarithmic and stationary phase, and in response to colistin 32 mgL−1 (mid-logarithmic cells).

