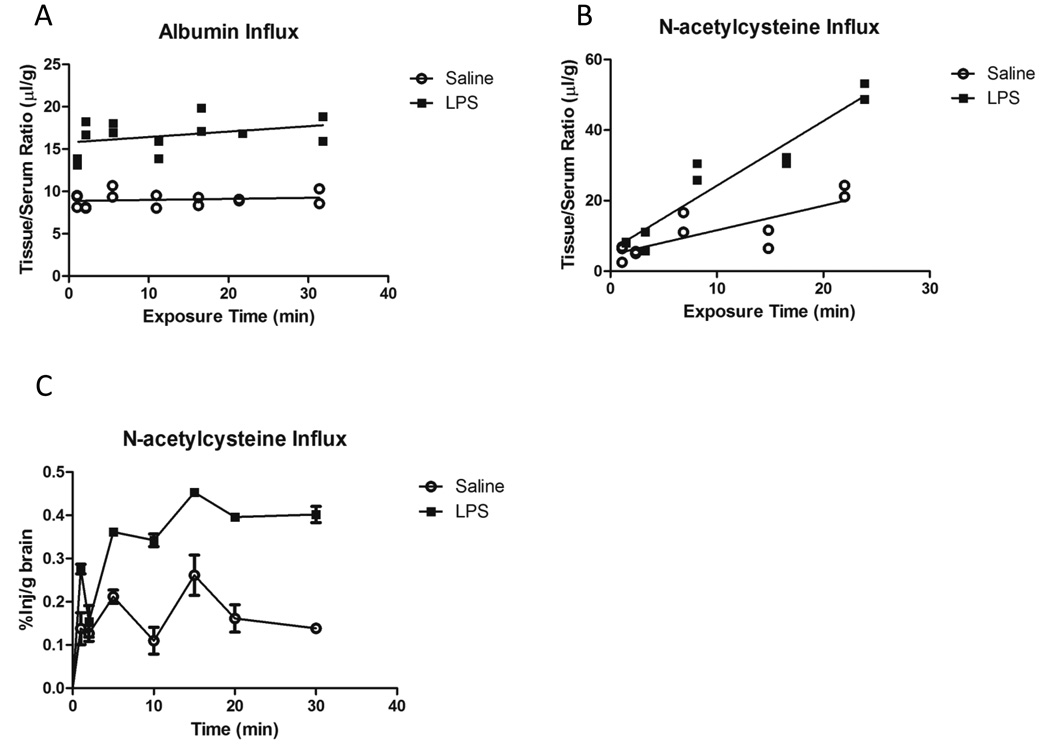
Figure 3. Brain influx of I-albumin and 14C-Nac following LPS treatment.
A) Albumin showed no significant difference in its influx rate (0.01218 ± 0.02102 µl/g-min Sal vs. 0.06413 ± 0.05179 µl/g-min LPS). A significant difference in the Y-intercept was observed (p < 0.001). B) Nac showed a significant difference in its influx rate (0.6954 ± 0.1663 µl/g-min Sal vs. 1.833 ± 0.1970 µl/g-min LPS; p < 0.001). Data analyzed by linear regression. C) Data represented as %Inj/g vs. clock time. A peak uptake of approximately 0.25 and 0.4 %Inj/g was observed for saline and LPS groups, respectively.

