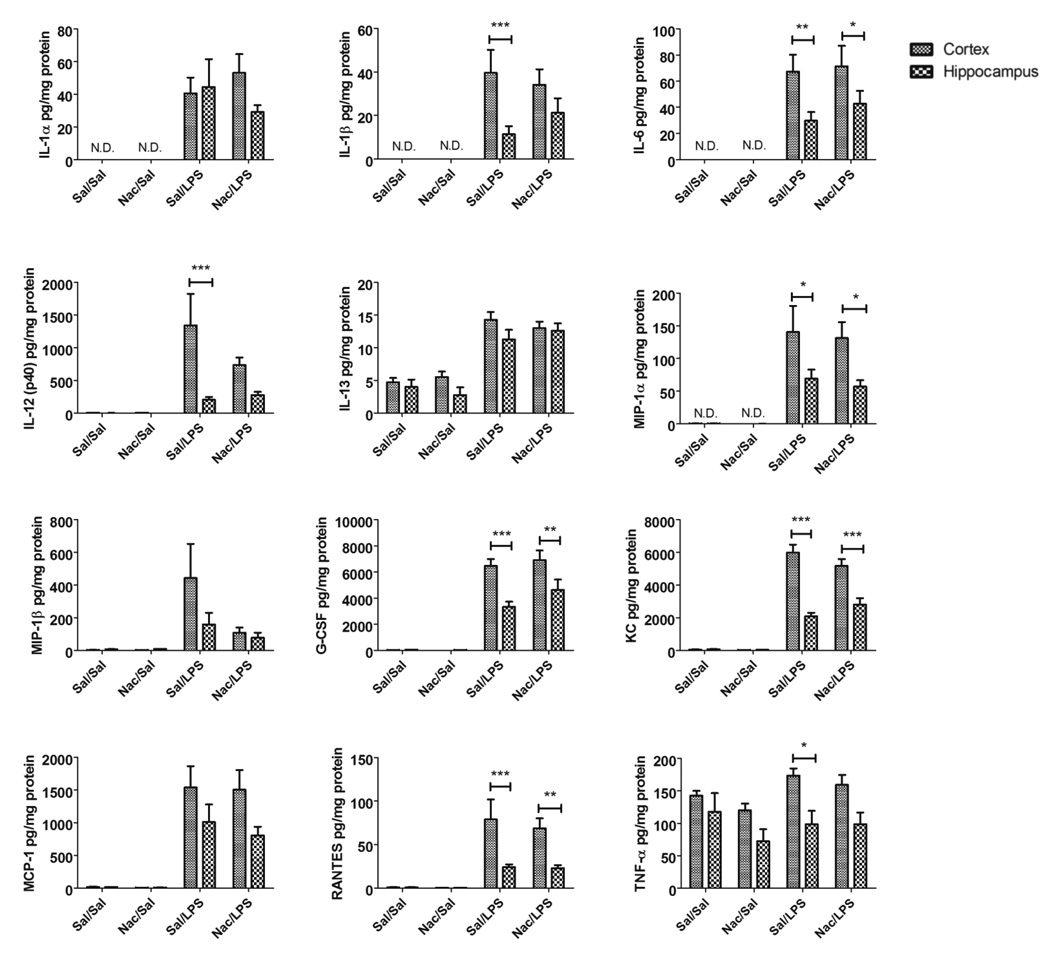
Figure 4. Comparison of cytokine levels in cortex vs. hippocampus.
Cytokines found to be significantly elevated at the protein level in both cortex and hippocampus by LPS were compared to determine whether there was a significant difference in cytokine expression between brain regions in any of the treatment groups. Data were analyzed by two-way ANOVA followed by Bonferroni multiple-comparisons tests, n=8–10 per group; *p < 0.05, **p < 0.05, ***p < 0.001 vs. group indicated.

