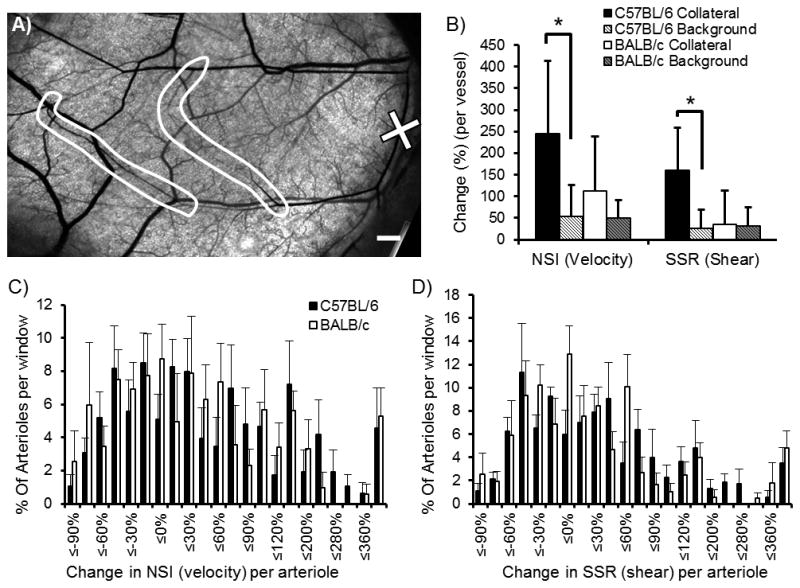
Figure 5. Network hemodynamic alterations after arteriole occlusion in C57BL/6 and BALB/c dorsal skinfold window chambers.

A) Representative window chamber network with the chosen site for micro-occlusion (marked by ‘X’) and the predicted collateral pathways (circled in white) (scale bar is 500 μm). B) Bar graph analysis of collateral and background arteriole pathways shows significant increase in collateral velocity and shear stress from pre- to 24 hrs post-microvessel occlusion for the C57BL/6 networks (*, p<0.05 between collateral and background changes within strain, n=5 windows per strain). C, D) Histograms representing global analysis of hemodynamic changes (NSI, proportional to velocity, and SSR, proportional to wall shear stress) without stratification. No significant differences were observed between strains (binned by percent change, n=5 windows per strain).
