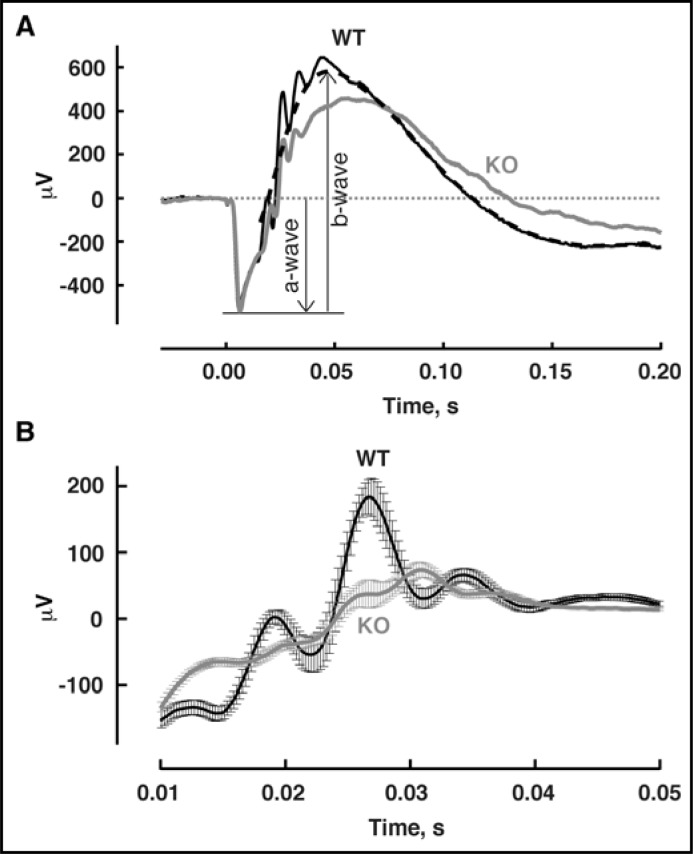
Fig. 11.
ERG recordings from WT and S100B KO mice. (A) Representative responses from a WT mouse and an S100B KO mouse to bright flashes that stimulated rods and cones. Traces average 3 trials for WT and 2 trials for S100B KO. Dashed line shows the digitally filtered version of the WT response (see Methods). (B) Smaller oscillatory potentials in S100B KO mice. Oscillatory potentials were extracted from the flash responses of WT and S100B KO as the residuals after digital filtering and then averaged (n = 19 WT mouse eyes and 24 S100B KO mouse eyes). Error bars show SEM.

