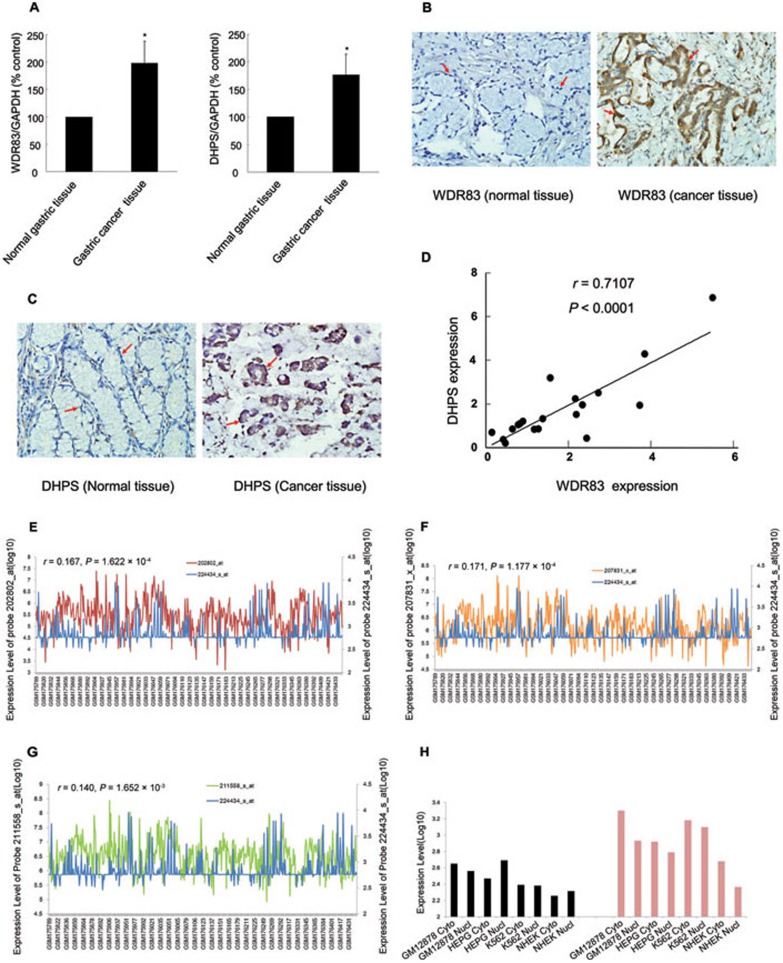
Figure 2.
Expression analysis and the subcellular location of WDR83 and DHPS in GC tissues and different cell lines. (A) WDR83 and DHPS mRNA levels were quantified by qPCR in 19 pairs of GC specimens and their matched normal tissues. WDR83 and DHPS expression were significantly increased in GC tissues compared with their normal tissues (P = 0.0198 and 0.0286, respectively, n = 19; *P< 0.05, **P< 0.01, ANOVA). (B, C) Representative expression of WDR83 and DHPS in GC specimens and their matched normal tissues as determined by IHC (magnification 200×); in GC tissues, high-level expression of WDR83 or DHPS was shown by strong staining. (D) Regression analysis of WDR83 and DHPS expression revealed that WDR83 and DHPS were positively correlated (r = 0.7107, P < 0.0001). The correlation coefficient (r) measured the reliability and the P-value measured the statistical significance of the correlation between the x and y variables. (E-G) Expression correlation analysis of WDR83 and DHPS in 504 normal tissues: (E) the expression of WDR83 (probe 224434_s_at, blue) and DHPS (probe 202802_at, red) exhibited a significantly positive correlation (r = 0.167, P< 0.00016); (F) the expression of WDR83 (probe 224434_s_at, blue) and DHPS (probe 207831_at, orange) also exhibited a significantly positive correlation (r = 0.171, P< 0.00012); (G) the expression of WDR83 (probe 224434_s_at, blue) and DHPS (probe 211558_s_at, green) exhibited concordant expression patterns (r = 0.140, P< 0.00017). (H) Subcellular location profiling of WDR83 and DHPS using the Affymetrix Tiling Array revealed that both genes were widely expressed in the cytoplasm and nucleus in different cell lines.

