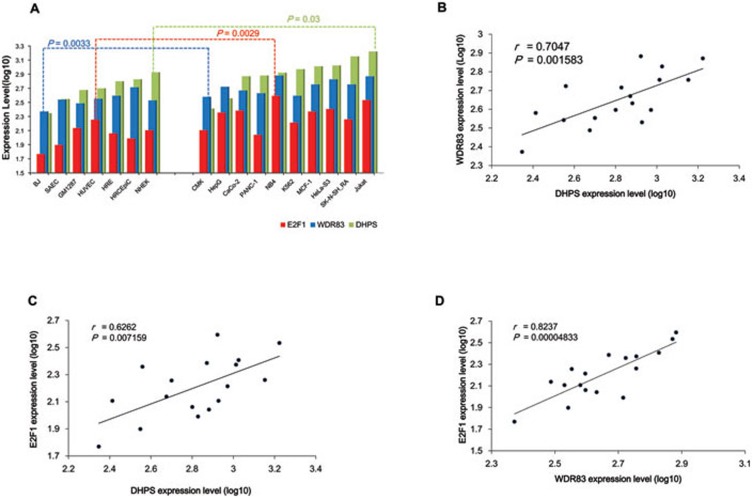
Figure 7.
Positive correlations between WDR83, DHPS, and E2F1 in other cancers. The expressions of WDR83, DHPS, and E2F1 were analyzed in normal (n = 7) and cancer (n = 10) cell lines. Transcriptional profiles were derived from the ENCODE Transcriptome Project with the Affymetrix Human Exon 1.0 ST array. (A) The expression of WDR83, DHPS, and E2F1 was increased significantly in cancer cells compared with normal cells (P = 0.0033, 0.030, and 0.0029, respectively). (B-D) The expression of WDR83, E2F1, and DHPS exhibited positive correlation in multiple cell lines (P = 0.0016, 0.0071, and 0.00005, respectively).

