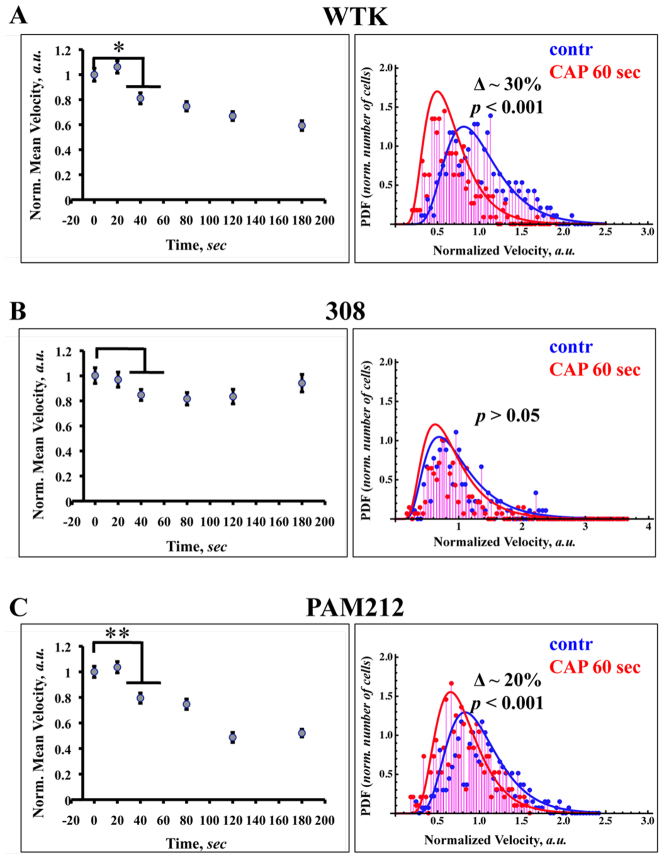
Figure 1. CAP effect on the cell migration and velocity distribution among the chosen cell population.
The dependence of the cells migration rates on the length of the CAP treatment from 0 to 180 seconds are shown for WTK, 308 and PAM 212 cells (Figure 1A–1C, left panel). SEM (standard error of mean) is shown with an error bars. For each time point ~50–60 cells were analyzed. The difference between groups were considered statistically not significant for p-value > 0.05 (no mark) and for p-value < 0.05 (single star), p-value < 0.01 (double star) and p-value < 0.001 (triple star) are considered significant. The probability distribution functions (PDF) of the cell migration rates (distribution of the cell velocities) for untreated cells (control, blue) and cells treated with cold atmospheric plasma for 60 seconds (plasma treated, red) are shown for WTK, 308 and PAM 212 cells (Figure 1A–1C, right panel). The experimental data (~250 cells of each cell type were analyzed for each condition) is fitted with inverse Gaussian distributions.

