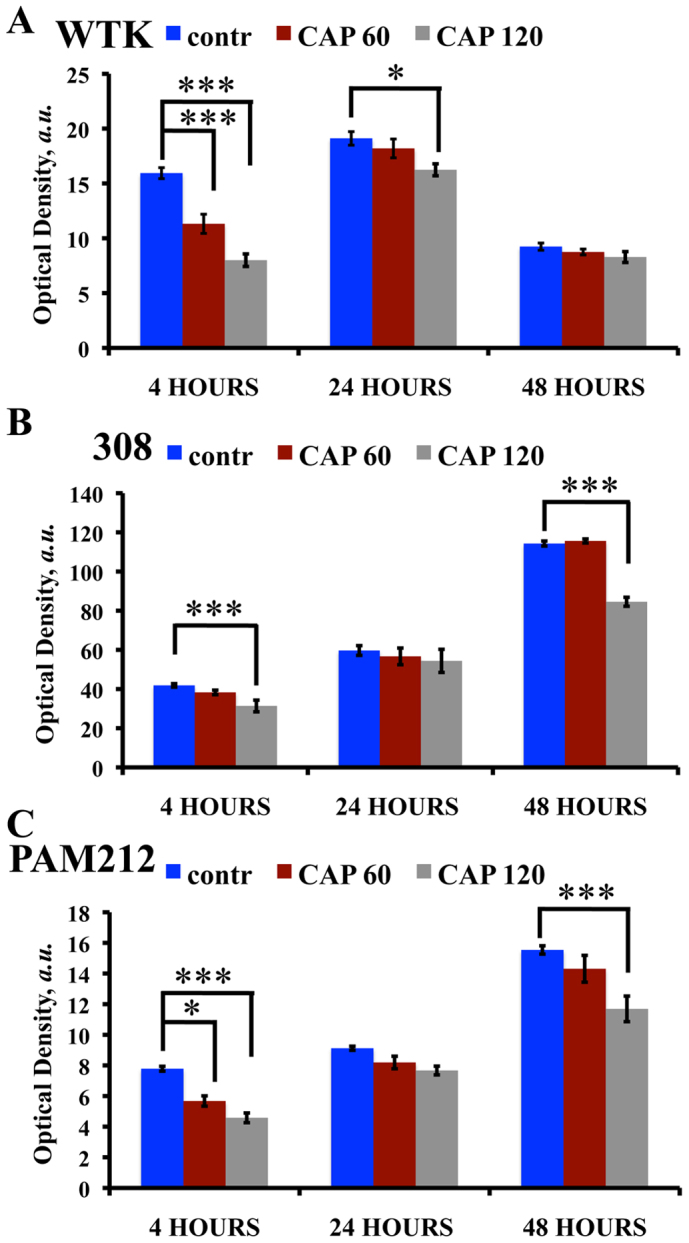
Figure 2. Cell viability studies in two threshold regimes.

MTT assay was performed on: (A) wild type keratinocytes (WTK), (B) 308 cells (papilloma) and (C) PAM212 cells (carcinoma). Control (not treated) is shown in blue, CAP treated for 60 seconds – in red and CAP treated for 120 seconds – in grey cells at 0, 4 and 24 hour time points. SEM is shown with an error bar. The experiment was repeated 3 times for each cell type and condition. Three stars denote extremely significant statistical difference (p-value < 0.001), one star – statistically significant difference (p-value < 0.05), data was considered statistically not different for p-value > 0.05.
