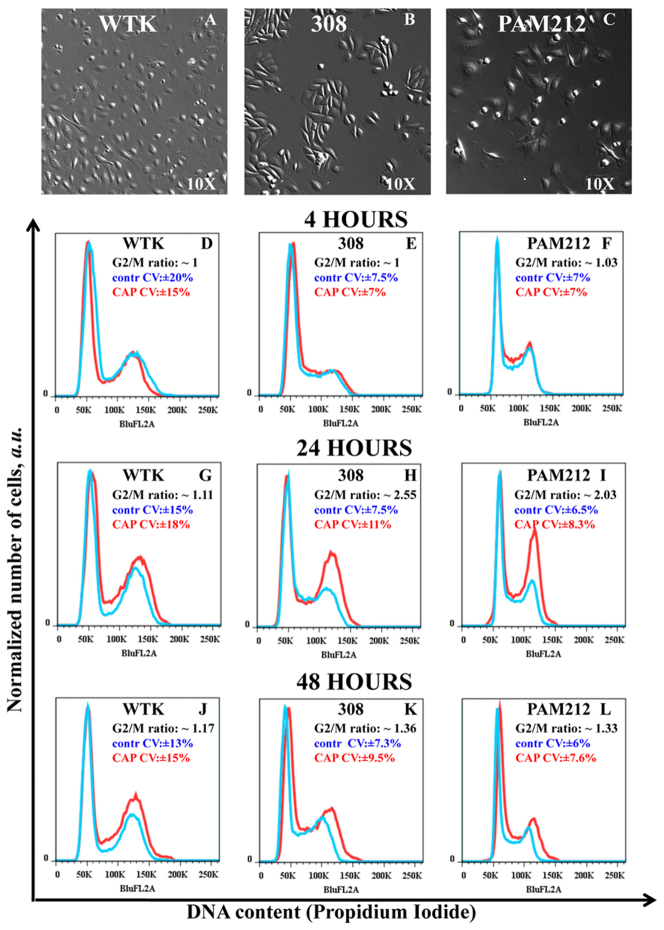
Figure 3. Identification of the cell cycle change in G2/M-phase.
Figure 3A–3C Bright-field images of wild type keratinocytes (WTK), epidermal papilloma (308 cells) and epidermal carcinoma (PAM212 cells) cells are shown with a magnification 10x. Figure 3D–3L show cell cycle studies: Propidium Iodide content (horizontal axis) and normalized number of cells (vertical axis) are shown. The controls are shown in blue and cells CAP treated for 60 seconds are in red. The ratio of the number of cells (treated to untreated) in G2/M-phase with coefficients of variation (CV, in percents) is shown in the right top corner of each figure. Figure 3D – 3F shows cell cycle measurements in ~4 hours; Figure 3G–3I in ~24 hours; and Figure 3J–3L in ~48 hours after the CAP treatment for WTK, 308 and PAM 212 cells respectively. The data is shown for ~25000–50000 cells for each experimental condition. The measurements were repeated 2–3 times.

