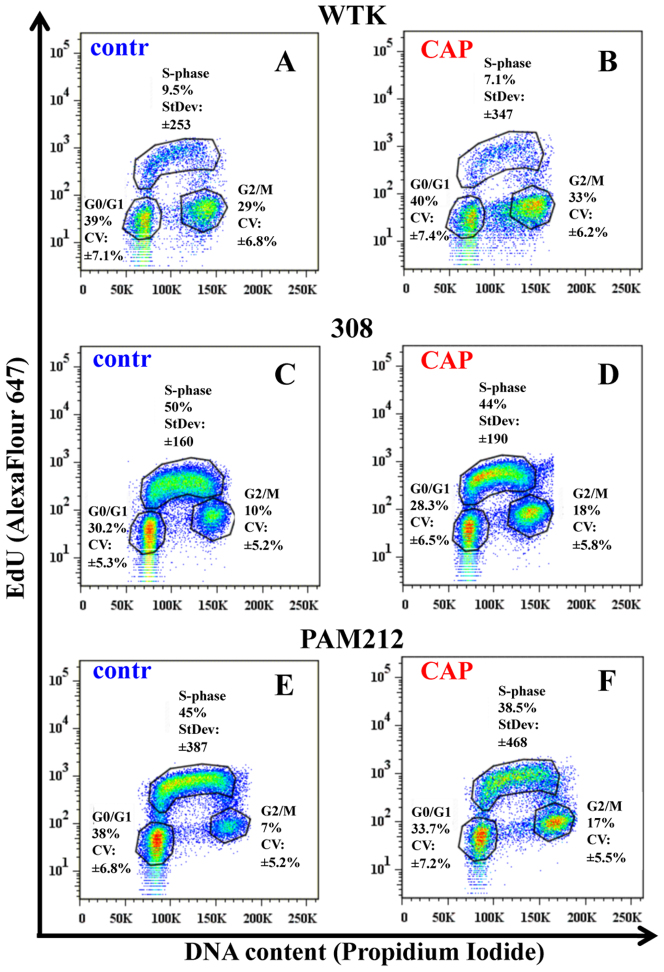
Figure 4. Studies of the cell population's distribution during the cell cycle after CAP treatment.
The detailed studies of the cell cycles for control and CAP treated for 60 seconds cells are shown. The correlation between DNA content (Propidium Iodide) and DNA-replicating cells (EdU-component) is shown for: Figure 4A, 4B – normal cells (wtk); Figure 4C, 4D–papilloma cells (308 cells); and Figure 4E, 4F–carcinoma cells (PAM212 cells) in ~24 hours after CAP treatment. Coefficient of variation (CV) was used to characterize the Propidium Iodide data (linear scale) and standard deviation (StDev) was used for EdU-data (log scale) in each phase. Fractions of the number of cells in each cell cycle phase are shown in percents. The data is shown for ~25000 cells for each experimental condition. The experiments were repeated 2–3 times.

