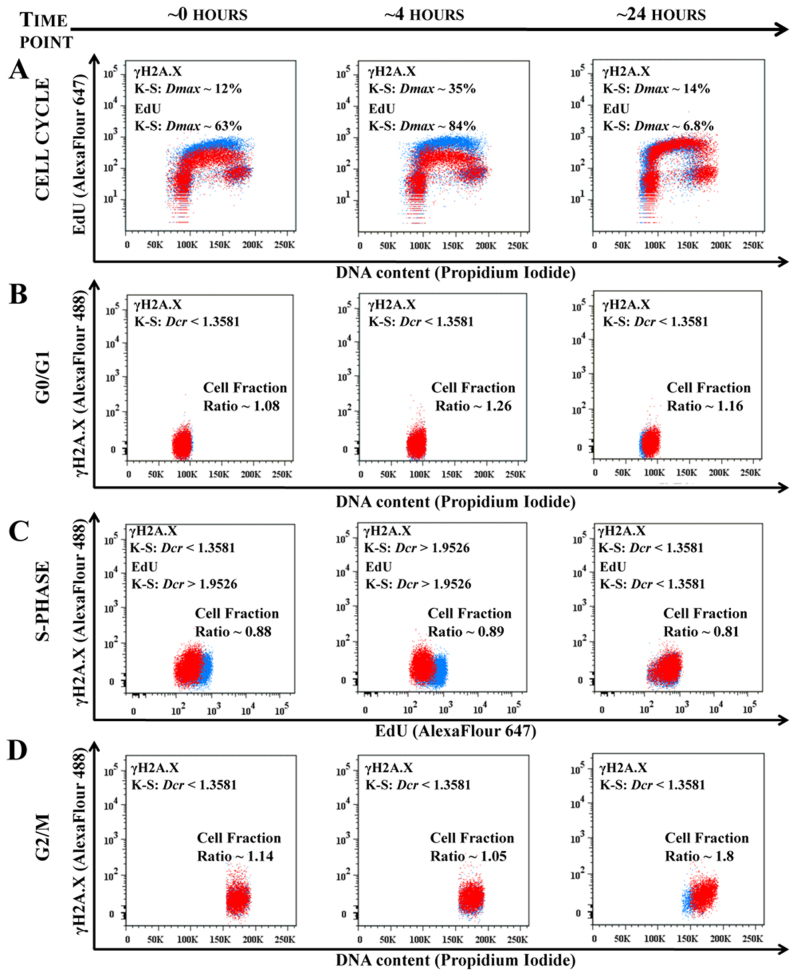
Figure 6. CAP targets the cell cycle phase.
The time sensitive studies of the 308 cells cell cycles are shown for the time points ~0 hour, ~4 hour and ~24 hours points after 60 seconds of CAP treatment. The control (not treated cells) is shown in blue, CAP treated cells is in red. Figure 6A shows the time evolution of the cell cycles (DNA content – vs. – DNA replicating cells) of control and CAP treated cell. The changes in EdU and γH2A.X signals are characterized by K-S maximum difference Dmax and Dcr values at the selected time point. Figure 6B shows the correlation between DNA content and γH2A.X reporter for G0/G1 cell phase; Figure 6C shows correlation between DNA replicating cells (EdU) and γH2A.X for 308 cells in S-phase; and Figure 6D shows correlation between DNA content and γH2A.X for the 308 for G2/M-phase for ~0, ~4 and ~24 hours time points. ~25000 cells are shown for each experimental condition. Changes in the fraction of cells between the control (not treated) and CAP treated cells are shown for each cell phase: cell number decreases if the ratio is less than 1. The statistical description of the signals shown in the Figure 6A is a maximum differences between two distributions in the S-phase with confidence interval 99.9%; in the Figures 6B–6D Dcr – value is shown: Dcr < 1.3581 (p > 0.05) is considered not statistically significant and Dcr > 1.9526 (p < 0.001) is extremely statistically different29.

