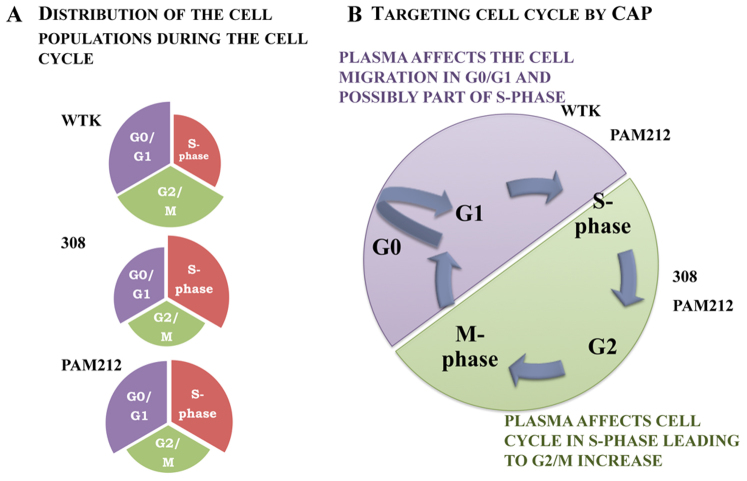
Figure 7. The schematic model of the CAP impact on the cell cycle.
Figure 7A is the schematic representation of the cells distribution during the cell cycle phase for analyzed types of cells: WTK, 308 and PAM212. Figure 7B is schematic of the CAP affect on the cell cycle with consequent cell response.

