Figure 2.

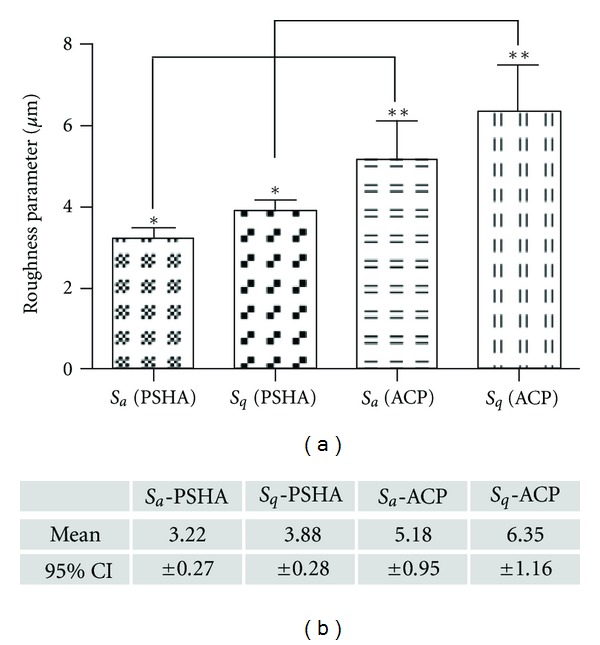
Micrometer S a and S q measurements resulted in significant differences for S a (P < 0.03) and S q (P < 0.02) between PSHA and ACP, with the ACP surface presenting higher values, as shown in the graphic and table.

Micrometer S a and S q measurements resulted in significant differences for S a (P < 0.03) and S q (P < 0.02) between PSHA and ACP, with the ACP surface presenting higher values, as shown in the graphic and table.