Figure 4.

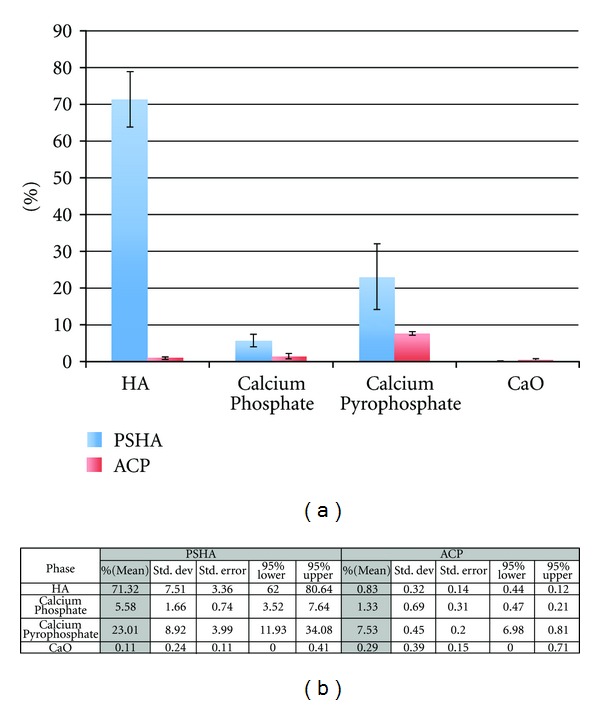
(a) Rietveld analysis using MAUD program for crystalline phase quantification of both PSHA and ACP surfaces. (b) Shows the phase fraction mean and 95% confidence intervals.

(a) Rietveld analysis using MAUD program for crystalline phase quantification of both PSHA and ACP surfaces. (b) Shows the phase fraction mean and 95% confidence intervals.