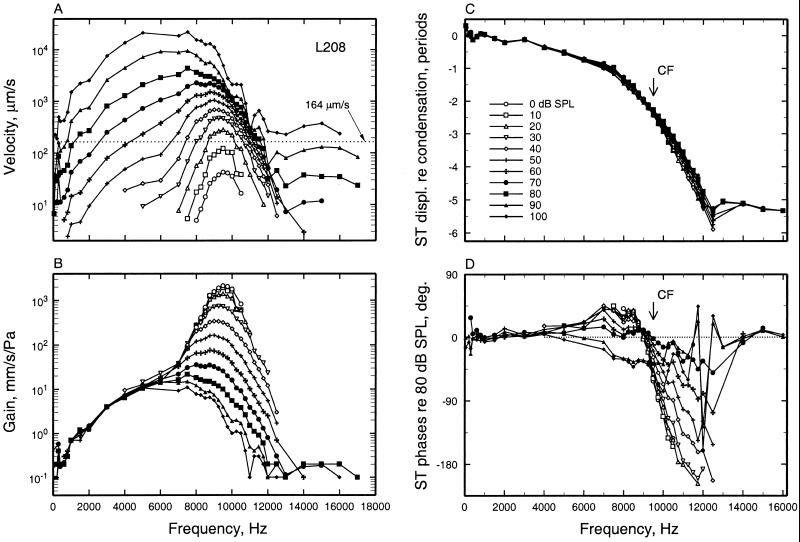
Figure 1.
The magnitudes and phases of BM responses to tones at the 3.5-mm site of the chinchilla cochlea. (A) Velocity magnitude as a function of stimulus frequency (abscissa) and level (parameter). The dotted line indicates the velocity corresponding to the CF threshold of the auditory-nerve fiber in Fig. 3B. (B) As in A, but normalized to stimulus pressure. (C) Response phases of peak displacement toward scala tympani, relative to peak condensation at the external ear canal, as a function of stimulus frequency and level. (D) As in C, but normalized to the phases of responses to 80-dB stimuli. Data from cochlea L208, recorded by using a laser vibrometer (59).

