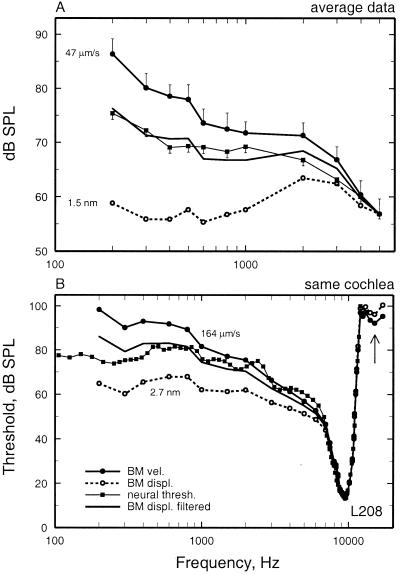
Figure 3.
Frequency tuning of BM vibrations and auditory-nerve fibers at the 3.5-mm site of the chinchilla cochlea. (A) An average frequency-threshold curve for auditory-nerve fibers is compared with the average tuning of BM responses in several cochleae, expressed as three curves indicating the stimulus levels at which BM vibration attains a displacement of 1.5 nm, a velocity of 47 μm/s, and a constant displacement high-pass filtered at a rate of 3.83 dB/octave. The three curves are equated to neural threshold at 5 kHz. BM data were measured in 18 cochleae by using laser velocimetry. The threshold averages of auditory-nerve fibers were based on data for 183 fibers with CF = 8–12 kHz recorded in 77 chinchillas. The data consisted of frequency-threshold tuning curves, measured with an automated adaptive algorithm (7, 60), and 0.5-s samples of responses to low-frequency tones (≤1 kHz) (9). Vertical bars indicate the SEM. (B) Frequency tuning of responses to tones of a BM site and an auditory-nerve fiber with similar characteristic frequency recorded in the same cochlea. The neural frequency-threshold tuning curve is compared with BM tuning curves indicating constant displacement (2.7 nm), constant velocity (164 μm/s), and displacement high-pass filtered at a rate of 3.81 dB/octave. The auditory-nerve fiber had spontaneous activity of 11.2 spikes/s. (B) Redrawn from figure 1B of Narayan et al. (8).

