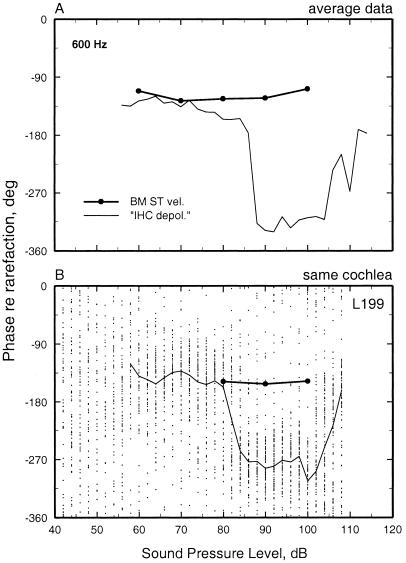
Figure 6.
The phases of BM and auditory-nerve-fiber responses to low-frequency tones as a function of stimulus level. (A) Average phases of responses to 600-Hz tones recorded at the BM of eight cochleae and from 27 auditory-nerve fibers with CF 8–12 kHz. (B) The responses to 600-Hz tones of a BM site and an auditory-nerve fiber (CF = 7. 1 kHz; spontaneous rate = 105 spikes/s) with similar CF recorded in the same cochlea. The phases of peak BM velocity toward scala tympani are indicated by ● connected by a thick line. The neural responses are depicted as a scatter diagram of phase vs. level, with each dot representing one spike. Stimuli were five repetitions of 100-ms tones, presented every 300 ms at random levels, with 2-dB steps. The mean phases of the neural responses are indicated by a thin line.

