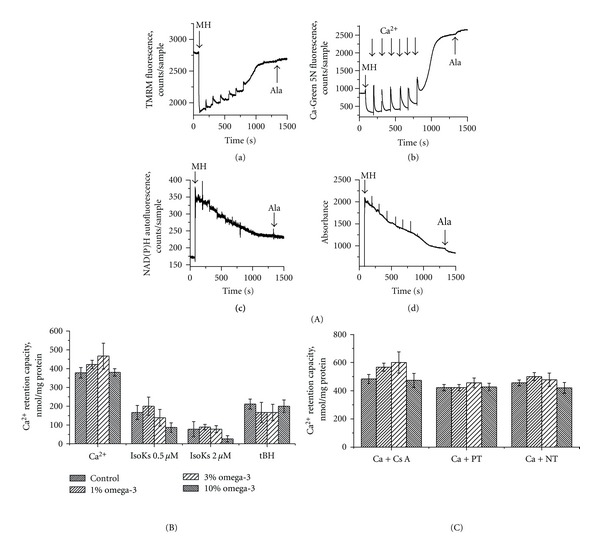
Figure 6.

Omega-3 PUFA enriched diet does not change brain mitochondria Ca2+ retention capacity. (A) Basic parameters of isolated from control rats brain mitochondria measured in the presence of the chain of Ca2+ additions (10 μM each addition) and 5 mM glutamate/malate as a substrate. (a) Mitochondrial ΔΨ was measured as changes in TMRM fluorescence signal. Addition of mitochondria into incubation buffer, indicated by arrow, induced the drop of TMRM signal (i.e., TMRM concentration in the buffer) due to the accumulation of the dye by mitochondria. The addition of Ca2+ induced an increase of TMRM signal, which corresponds to lower ΔΨ, and a subsequent decrease of the TMRM signal, which indicates a restoration of ΔΨ. (b) Ca2+ concentration in the mitochondrial suspension was measured as Ca-Green 5N fluorescence signal. A higher signal corresponds to an increase of Ca2+ concentration in the buffer. (c) NAD(P)H autofluorescence signal. A lower signal corresponds to a more oxidized state of NAD(P)H. (d) Mitochondrial swelling was measured as changes in light scattering of the mitochondrial suspension. A decrease in the fluorescence signal indicates an increase in swelling. Spikes resulting from additions of Ca2+ were manually reduced; arrows are used to indicate where these manipulations occurred. Representative traces from 6 experiments are shown. (B) CRC determined in the presence of Ca2+, Ca2+ + IsoK (0.5 and 2 μM), Ca2+ + tBH (100 μM); (C) Ca2+ + Cs A (0.5 μM), Ca2+ + promethazine (PT) (3 μM), and Ca2+ + nortriptyline (NT) (3 μM), use (B) for comparison. Glutamate/malate (5 mM) was used as the substrate. The data are expressed in nmol of Ca2+ consumed by mitochondria per mg of mitochondrial protein and are the mean ± SEM, n = 6. Statistical significance in CRC between tested samples was determined by a two-sample t-test.
