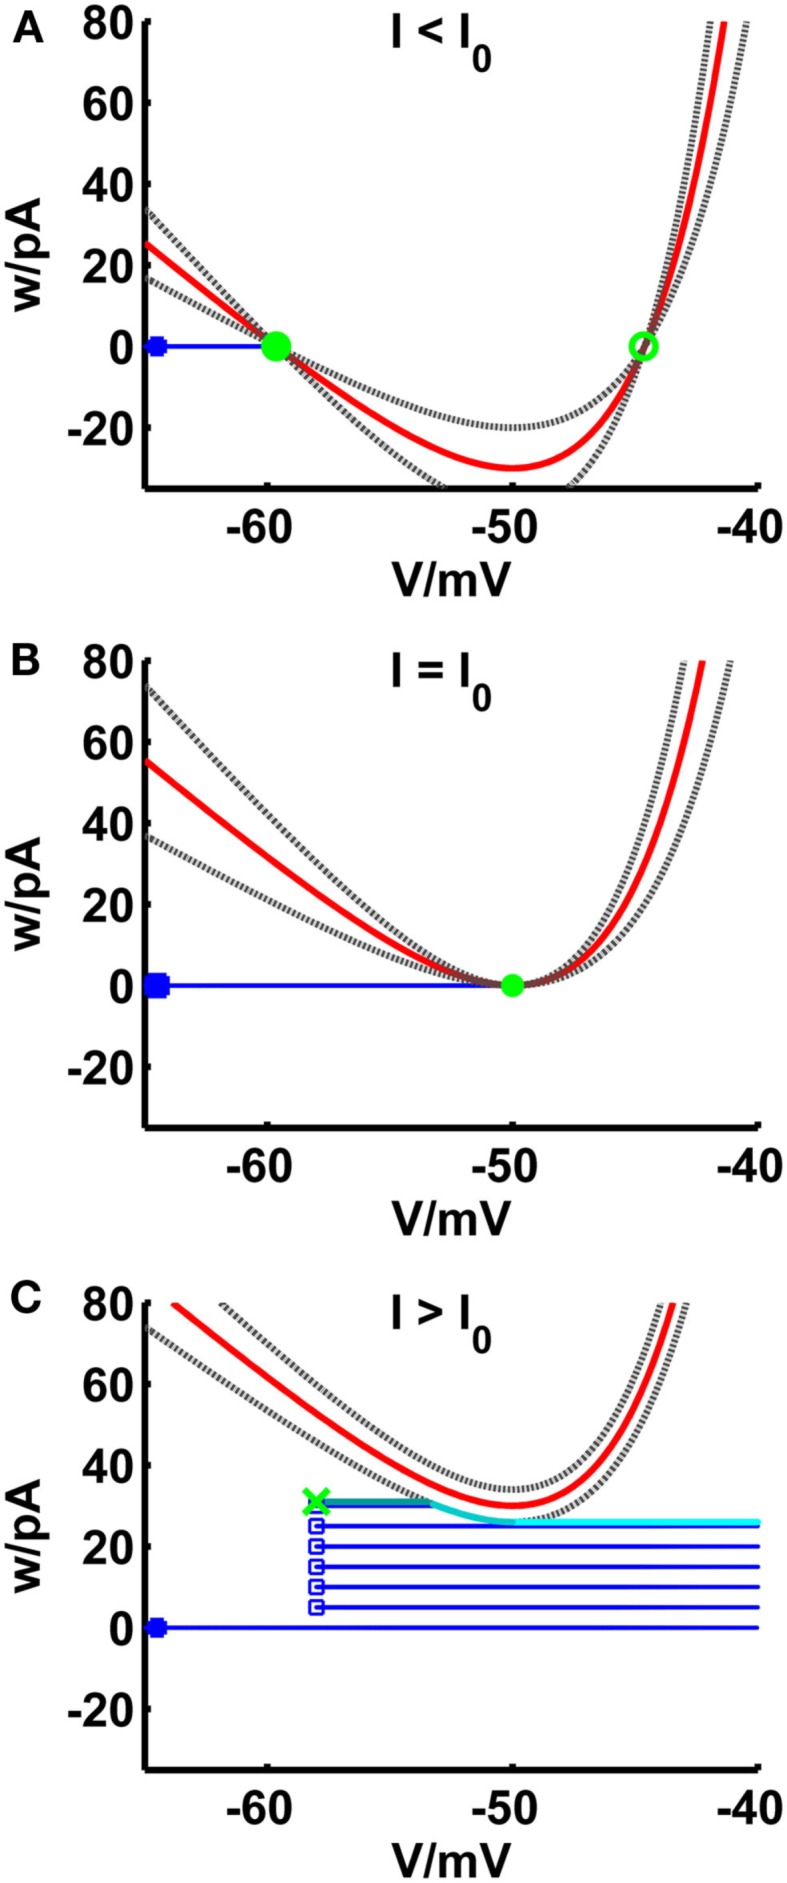
Figure 2.

Comparison of phase planes of the simpAdEx for I less than (A), equal (B) and greater than (C) the rheobase. The V-nullcline (in red) and the curves el and er (gray dashed lines) are shifted upwards with increasing input current. For I less than or equal the rheobase, the three curves have a maximum of two shared intersection points (one stable node given by the filled green circle and one unstable node represented by an open green circle) which coincide at the saddle point V = VT. The trajectory is given in blue with the blue filled square representing the initial point and the open blue squares indicating the reset points. The steady-state trajectory starts at the green cross and passes through three sections: It runs horizontal up to the intersection point with the envelope el (dark cyan line) where it follows el up to its minimum at VT (cyan line). The third part of the trajectory is again horizontal (light cyan line). Note that the distances of the curves el and er to the V-nullcline have been enlarged for clarity.
