Figure 7.
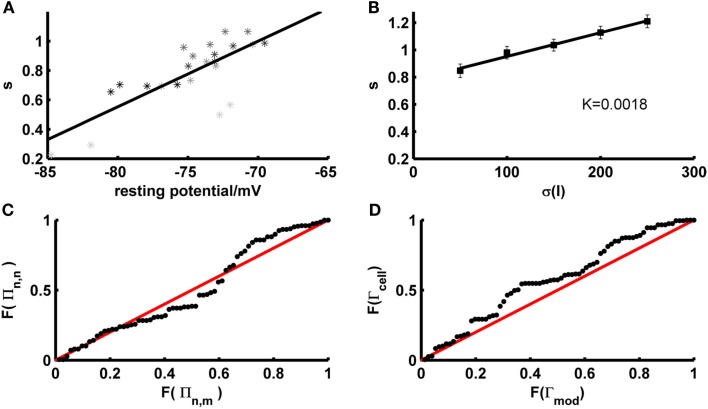
Determinants and implications of the scaling factor in model prediction performance. (A) The optimal scaling factor as a function of the experimentally recorded resting potential for 4 example test sets (gray to black shaded asterisks). Asterisks with she same shade of gray belong to identical repetitions of the same stimulus. (B) The optimal scaling factor as a function of the SD σ averaged across five layer-5 pyramidal cells (mean current μ = 25 pA). K = slope of the linear fit. (C) P–P plot of the distributions F of the firing rate agreement measure between model and neuron Πn,m (without scaling factor) and the firing rate agreement measure between different trials of the neuron Πn,n for a subset of the data (σ ∈ {35,50}, μ ≤ rheobase). The line F(Πn,n) = F(Πn,m) is given in red. (D) P–P plot of the distributions F of the model performance Γmod (with scaling factor) and the cell reliability Γcell for a subset of the data (σ ∈ {35,50}, μ ≤ rheobase). The line F(Γmod) = F(Γcell) is given in red.

