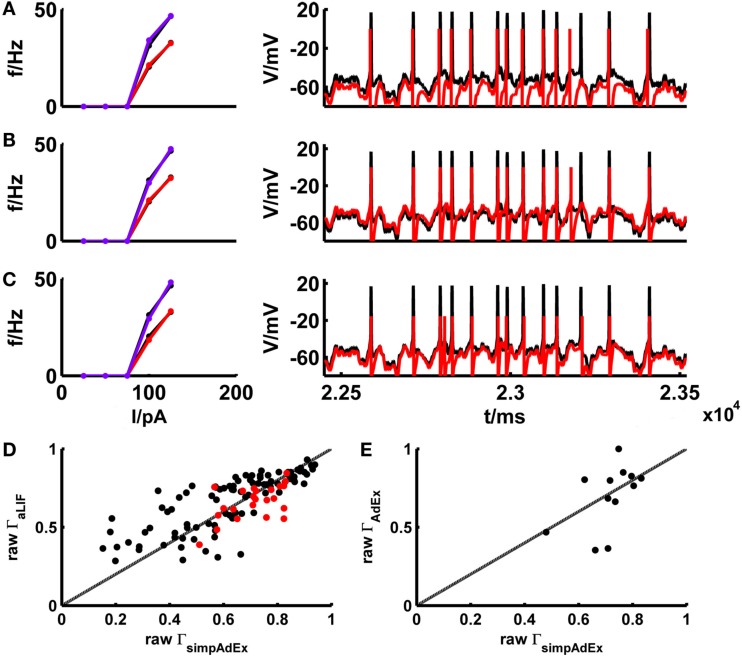
Figure 8.
Comparison of the simplified AdEx (simpAdEx) with the adaptive LIF neuron (aLIF) and the full AdEx. The onset and steady-state f–I curves and the test set consisting of a voltage trace upon a fluctuating input current for a fast-spiking interneuron from the rodent prefrontal cortex are given in black. The corresponding model fits [(A) aLIF, (B) simpAdEx, and (C) AdEx] are given in red (steady-state f-I curve) and blue (onset f–I curve). (D) The raw coincidence rate Γ for a window Δ = 20 ms for 170 evaluated test sets from 39 cells (layer-3 and -5 pyramidal cells, fast spiking and bitufted interneurons) for aLIF and simpAdEx. Black dots = σ ∈ {35,50}, red dots = σ ∈ {100, 150,200,250}. (E) Raw Γ for a window Δ = 20 ms for 12 evaluated test sets of 5 cells (see Table 2) for AdEx and simpAdEx. A scaling factor for eliminating firing rate differences was included in all model comparisons (see text).

