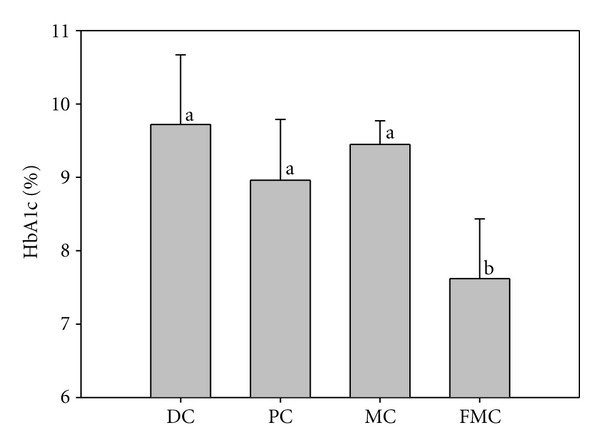
Figure 3.

Effect of FMC on HbA1c levels (%) in KK-Ay mice after 90 days. DC: diabetic control, PC: positive control (banaba), MC: Morinda citrifolia, FMC: fermented Morinda citrifolia. Each bar represents the mean ± SD (n = 7). Bars with different letters represent values that are significantly different from each other based on one-way ANOVA and the Duncan's multiple range test (P < 0.05).
