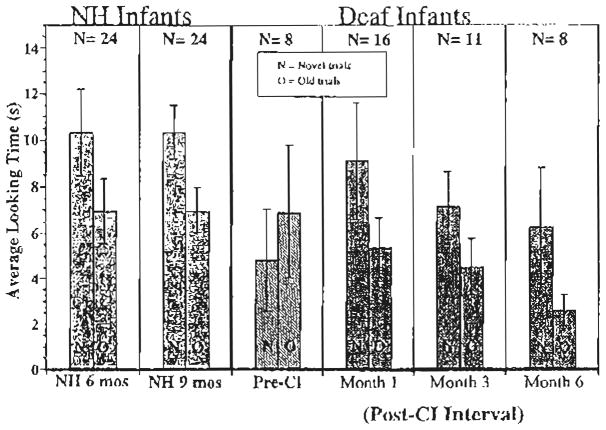
Fig. 7.
Speech discrimination. Mean looking times to the novel and the old trial for NH controls and for deaf infants before and at several intervals after CI. This figure represents the same looking time data as in Fig. 4 but shows mean looking times rather than mean difference in looking times, and, in this figure, looking times are combined across stimulus conditions.

