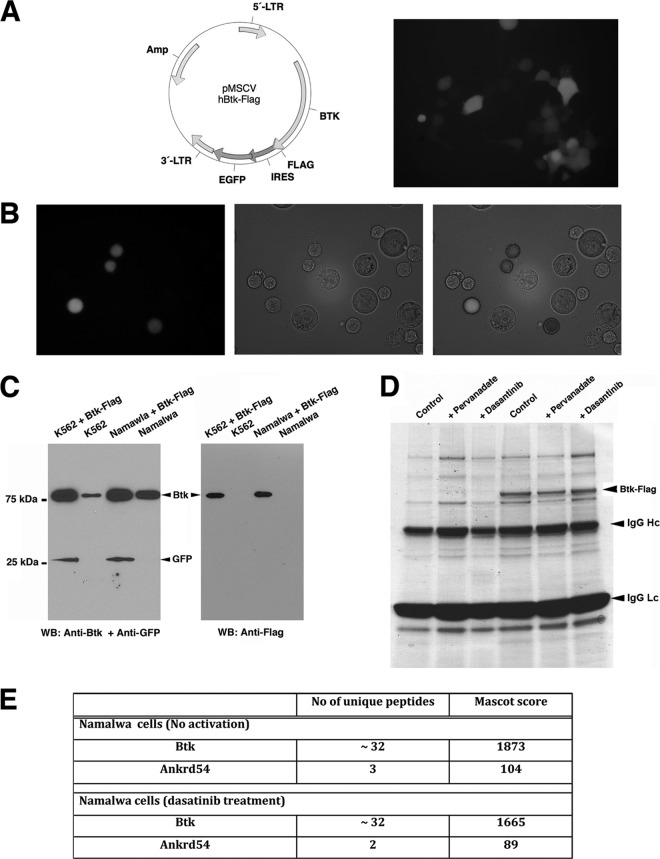
Fig 1.
Strategy used to create the biological model for proteomics analysis. (A) Schematic representation of the pMSCV vector cloned with Btk-Flag and live-cell imaging of Phoenix GP cells expressing the Btk-Flag-IRES-EGFP for production of viral particles. (B) Live-cell imaging of Namalwa cells after retroviral transduction to establish stable expression of Btk-Flag and EGFP with the same transcript. (C) Western blotting of the stable cell lines Namalwa and K562. (D) Typical experiment of immunopurification of Btk-Flag protein complexes. Protein staining shows residual bound proteins on anti-Flag M2-agarose beads after the elution procedure (see Materials and Methods). The eluted samples were prepared for gel-free mass spectrometry analysis. The eluted proteins were much less contaminated than the gel-stained proteins (D), with respect to heavy (IgG Hc)- and light (IgG Lc)-chain protein bands. (E) ANKRD54 is identified in Btk immunoprecipitates. Flag-tagged Btk was captured with anti-Flag M2 agarose from Namalwa cells under the indicated conditions. Mass spectrometry analysis was employed to identify interacting partners. The number of unique peptides and Mascot search algorithm scores are shown.

