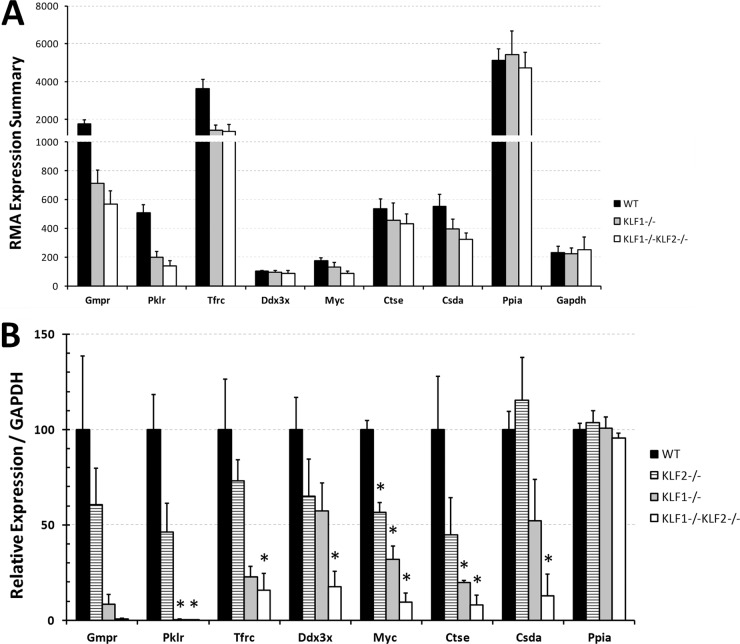
Fig 2.
(A) RMA expression summaries for selected genes regulated by KLF1 and KLF2. LCM was performed to collect independent E9.5 WT, KLF1−/−, and KLF1−/− KLF2−/− mouse erythroid precursor cells. Peptidylprolyl isomerase A (PPIA) and glyceraldehyde 3-phosphate dehydrogenase (GAPDH) mRNAs were used as negative controls that are not regulated by KLF1 or KLF2. The average and normalized RMA expression summary is indicated on the y axis. Black bars indicate WT (n = 8) samples, gray bars indicate KLF1−/− (n = 3) samples, and white bars indicate KLF1−/− KLF2−/− (n = 3) samples. The error bars indicate the standard errors. (B) qRT-PCR verification of KLF1- and KLF2-regulated genes identified by microarray analyses. Independent samples of E10.5 WT, KLF1−/−, KLF2−/−, and KLF1−/− KLF2−/− peripheral blood cells were collected. qRT-PCR was performed with at least 100 erythroid cells per assay. GAPDH mRNA was used to normalize the data. The expression amounts in the mutants are expressed relative to those in the WT (100%). PPIA mRNA was used as a negative control. Black bars indicate WT samples, striped bars indicate KLF2−/− samples, gray bars indicate KLF1−/− samples, and white bars indicate KLF1−/− KLF2−/− samples. The values shown are mean of at least 3 independent samples. The error bars indicate the standard errors. Asterisks indicate significant difference from the WT (P < 0.05).

