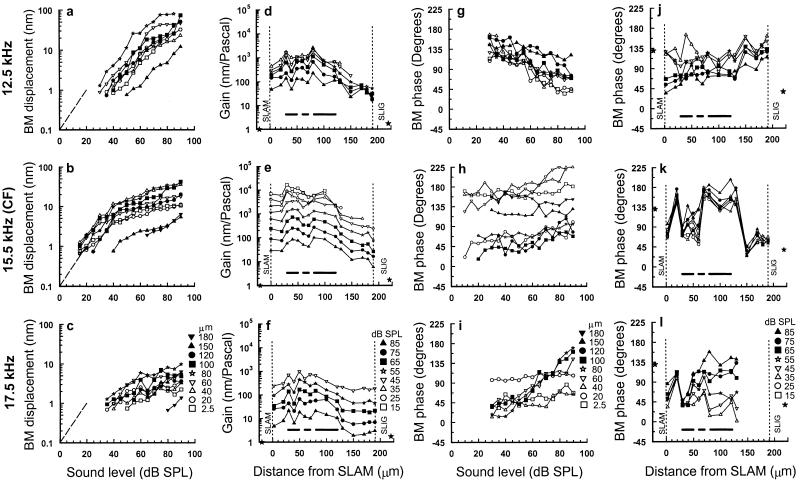
Figure 3.
(a–c) BM displacement-level functions in response to 12.5 kHz, 15.5 kHz (CF), and 17.5 kHz tones for different locations across the width of the BM. The locations are measured from the edge of the spiral lamina (symbols shown in c). Dashed line indicates slope of 1. (d–f) BM gain (nanometers/Pascal) in response to 12.5-kHz, 15.5-kHz (CF), and 17.5-kHz tones as a function of measurement location across the width of the BM for stimulus levels between 15 and 85 dB SPL (symbols shown in f). The solid stars represent BM gain of vibrations measured on the spiral lamina attachment (SLAM) (0.7) and spiral ligament attachment (SLIG) (1.7) at 95 dB SPL from a postmortem preparation. (g–i) BM phase as a function of the stimulus level of 12.5-kHz, 15.5-kHz (CF), and 17.5-kHz tones for different measuring locations across the width of the BM (symbols shown in i). (j–l) BM phase in response to 12.5-kHz, 15.5-kHz (CF), and 17.5-kHz tones as a function of measurement location across the width of the BM for stimulus levels between 15–85 dB SPL (symbols shown in l). The solid stars represent BM phase of vibrations measured on the SLAM and SLIG at 95 dB SPL from a postmortem preparation. The vertical dashed lines represent the inner SLAM and outer SLIG of the BM. Horizontal bars as in Fig. 1d; BM width: 190 μm; CAP threshold at CF: 12 dB SPL; 0 dB loss after opening cochlea to expose the BM; measurement noise floor 0.7 nm. b, e, h, and k are from Nilsen and Russell (22), with permission from Nature Neuroscience (Copyright 1999).

