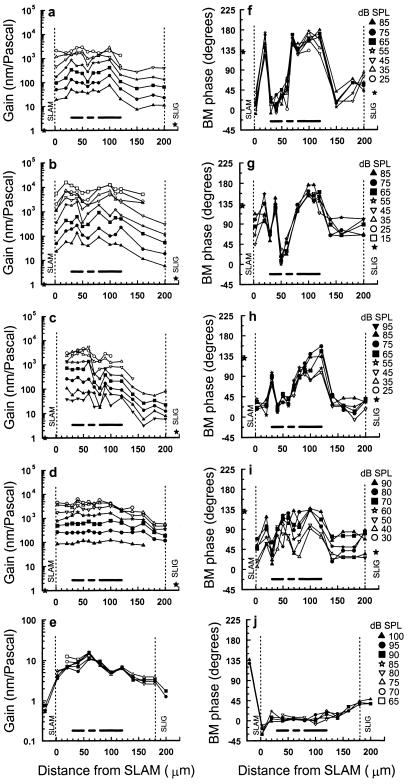
Figure 4.
BM responses as a function of measurement location across the width of the BM at different stimulus levels (symbols for each preparation shown on the right), measured under different recording conditions. (a and b) BM gain (nanometers/Pascal) and (f and g) BM phase measured from sensitive preparations with no perceptible loss in sensitivity, CF = 15.5 kHz (a and f), 18 kHz (b and g). (c) BM gain and (h) BM phase measured from a preparation with a 10-dB loss of sensitivity in initial preparation, CF = 16 kHz. (d) BM gain and (i) BM phase measured from a preparation with a 15- to 20-dB loss of sensitivity in initial preparation, CF = 18.25 kHz. The solid stars represent BM gain and phase of vibrations measured on the SLAM (0.7) and SLIG (1.7) at 95 dB SPL from the postmortem preparation in e. (e) BM gain and (j) BM phase measurements made 1.5–4 h postmortem near the 15.5-kHz location of the BM. The vertical dashed lines represent the inner spiral lamina attachment (SLAM) and outer spiral ligament attachment (SLIG) of the BM. Horizontal bars as in Fig. 1d.

