
Fig 3.
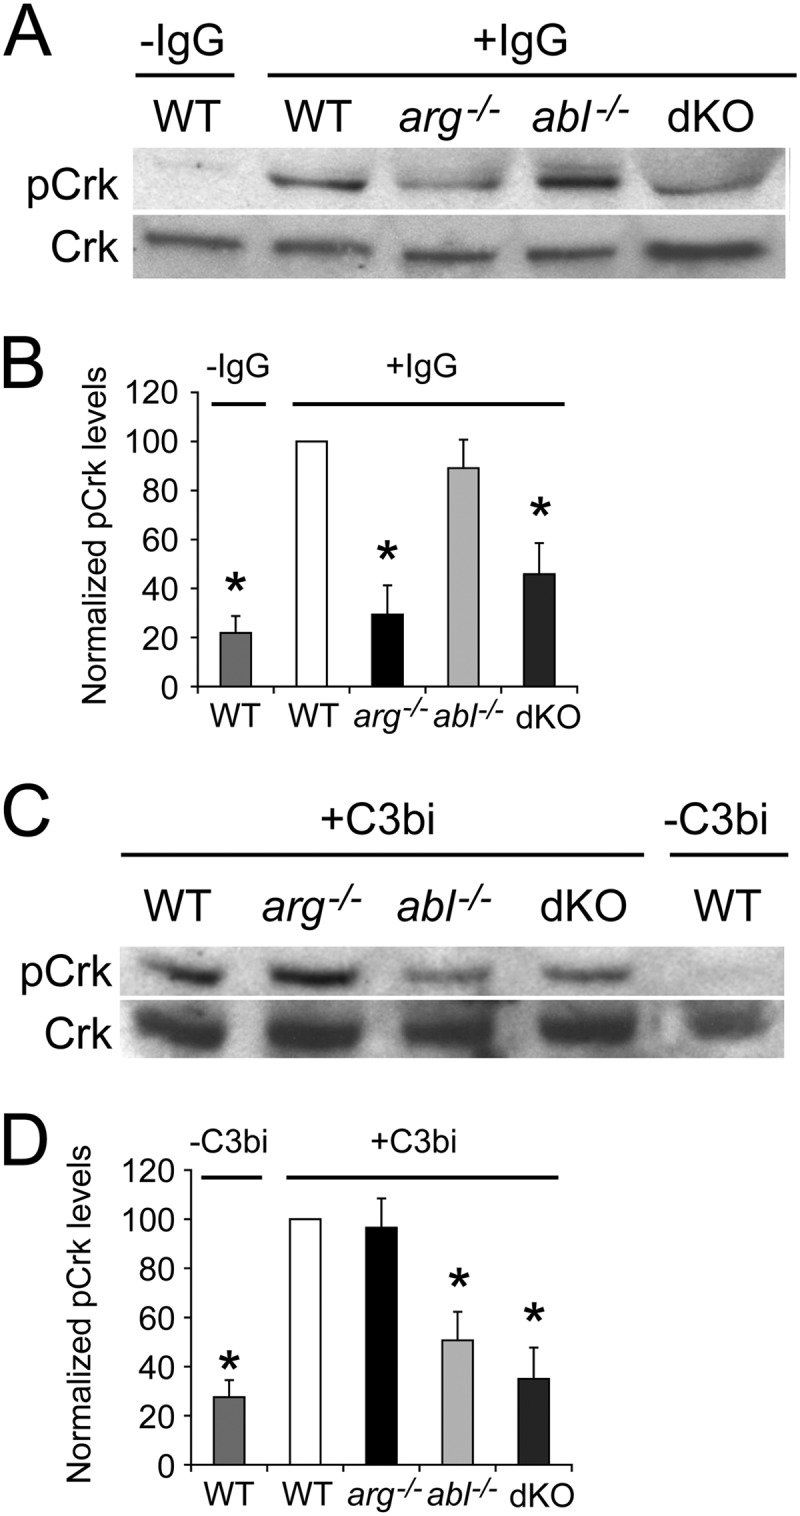
Arg and Abl stimulate Crk phosphorylation following engagement of the FcR and CR3 receptors, respectively. (A and B) Phosphorylation of the Abl/Arg substrate CrkII (pCrk) induced upon FcR engagement is decreased in arg−/− and dKO Mϕs compared to WT or abl−/− Mϕs. M-CSF-starved-Mϕs were adhered to uncoated plates (−IgG) or plates coated with mouse IgG1 (+IgG) for 15 min before lysis and processing for immunoblotting with an antibody to pCrk. (A) Representative immunoblot of pCrk (top) and total Crk (bottom) in WT Mϕs (± IgG) and IgG-stimulated arg−/−, abl−/− and dKO Mϕs. (B) Graph showing relative levels of pCrk, normalized to Crk levels, among WT (±IgG), arg−/−, abl−/−, and dKO Mϕs. Relative levels of pCrk for each category have been normalized to the level in IgG-treated WT Mϕs. *, P < 0.05 by ANOVA when pCrk levels in starred categories are compared to IgG-stimulated WT or abl−/− Mϕs (n = 5 experiments). (C and D) CR3 engagement-induced Crk phosphorylation is decreased in abl−/− and dKO Mϕs compared to WT or arg−/− Mϕs. Mϕs were added to uncoated plates (−C3bi) or C3bi-coated plates (+C3bi) for 15 min before processing as described above. (C) Representative immunoblot of pCrk (top) and Crk (bottom) in C3bi-stimulated WT, arg−/−, abl−/−, and dKO Mϕs and unstimulated WT Mϕs. (D) Graph showing relative levels of pCrk, normalized to Crk, among unstimulated WT Mϕs and C3bi-stimulated WT, arg−/−, abl−/−, and dKO Mϕs. *, P < 0.05 by ANOVA if pCrk levels in starred categories are compared to levels in either WT or arg−/− Mϕs (n = 5 experiments).