Fig 1.
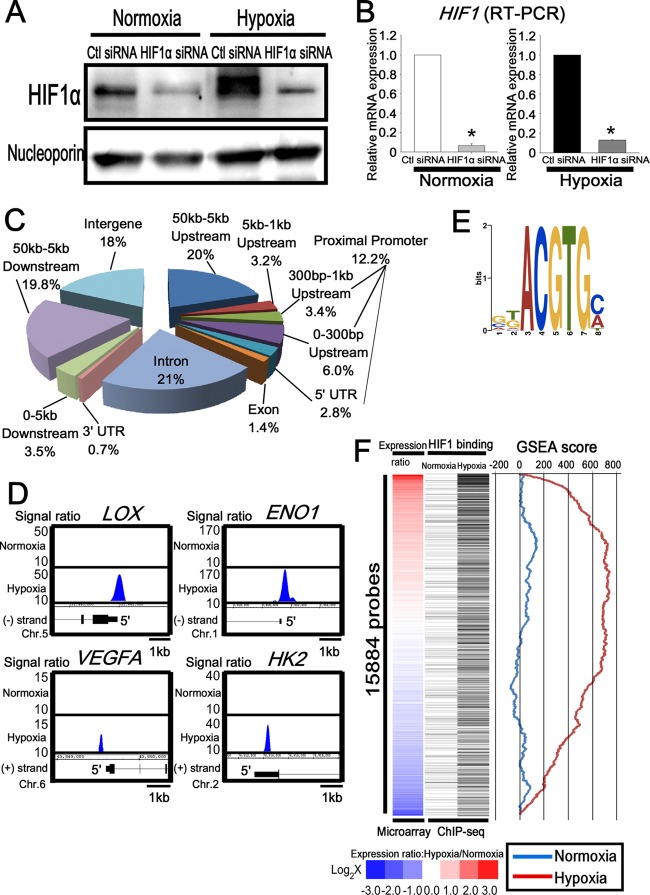
Genome-wide analysis of HIF1 binding sites in endothelial cells. (A) Western blot analysis of HIF1 in the nuclear extract of HUVECs transfected with control or HIF1α siRNA. Antinucleoporin antibody was used as a loading control. The experiments were performed three times independently. (B) Quantitative RT-PCR analysis of HIF1 mRNA in HUVECs transfected with control or HIF1α siRNA. The experiments were performed three times independently. *, P < 0.05 compared with control siRNA. (C) Distribution of HIF1 binding sites on a genome-wide scale under hypoxia. (D) Representative HIF1 ChIP-seq results in HUVECs under normoxia and hypoxia. LOX, ENO1, VEGFA, and HK2 are well-known targets of HIF1. (E) Schematic representation of the most significantly enriched motif in the HIF1 binding sites under hypoxia. (F) Comparison of HIF1 binding and the expression value under normoxia and hypoxia. The heat map of the expression ratio (normoxia versus hypoxia) is shown on the left and is based on the induction ratio under hypoxia. Each black bar, shown in the middle, indicates HIF1 binding probes for ChIP-seq. GSEA results, shown on the right, revealed the correlation between the expression ratio (normoxia versus hypoxia) and the HIF1 binding gene profiles.

