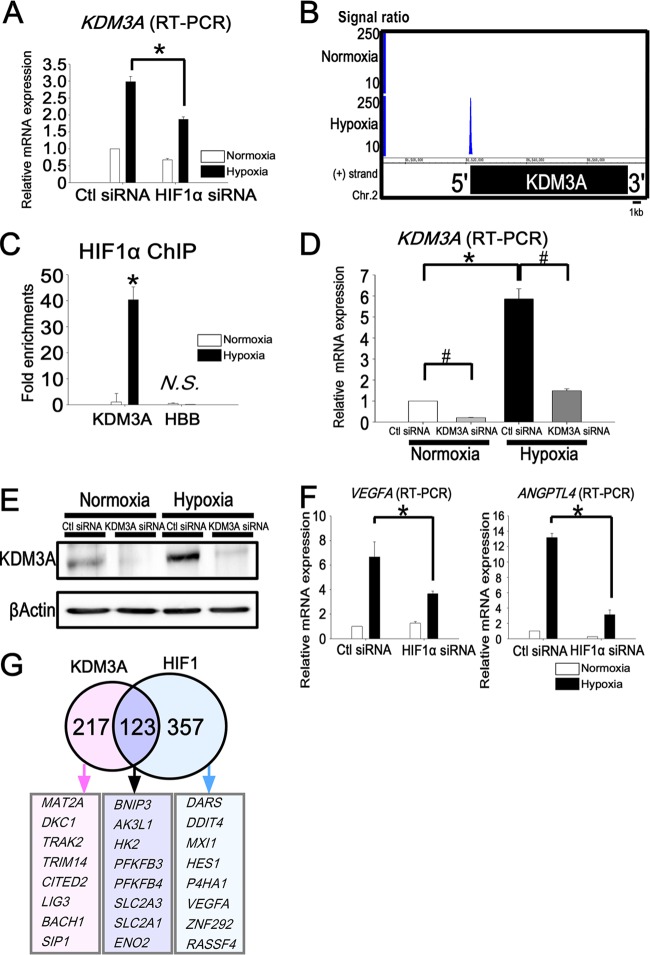
Fig 2.
Target genes of KDM3A overlap with those of HIF1 and are upregulated early under hypoxia. (A) Quantitative RT-PCR of KDM3A showed upregulation under hypoxia and reduction by HIF1α knockdown. The experiments were performed three times independently. (B) HIF1 ChIP-seq data for the KDM3A locus. HIF1 binds to the promoter region of KDM3A only under hypoxia. (C) Binding of HIF1 to the KDM3A locus was validated by ChIP-PCR. The fold enrichment is shown along with the input. HBB is a negative-control primer, which was designed for the promoter regions of chromosome 2 (forward, 5205042 to 5205061; reverse, 5204825 to 5204846). *, P < 0.05 compared with normoxia; N.S., nonsignificant. (D) Quantitative RT-PCR analysis of KDM3A mRNA in HUVECs transfected with control or KDM3A siRNA. The experiments were performed three times independently. *, P < 0.05 compared with normoxia; #, P < 0.05 compared with control siRNA. (E) Western blot analysis of KDM3A in HUVECs transfected with control or KDM3A siRNA. β-Actin was used as a loading control. The experiments were performed three times independently. (F) Representative quantitative RT-PCR analysis of VEGFA and ANGPTL4 in HUVECs transfected with control or HIF1α siRNA. VEGFA and ANGPTL4 were upregulated under hypoxia when control siRNA was transfected into HUVECs, while this upregulation was reduced under hypoxia when HIF1α was knocked down. *, P < 0.05 compared with control siRNA. The experiments were performed three times independently. (G) Venn diagram depicting the overlap of HIF1 and KDM3A downstream target probes. The numbers indicate the HIF1 and KDM3A common and unique downstream target gene probe sets. The representative gene symbols are shown in the lower panel.

