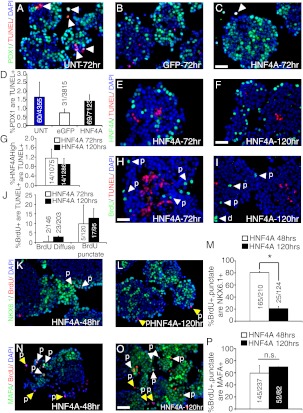
Fig. 4.
Partial loss of lineage fidelity is the predominant fate of β-cells overexpressing HNF4α8. Immunofluorescence analysis of Pdx1 (green), TUNEL (red), and DAPI (blue) in (A) untransduced, (B) AdCMV-eGFP-, and (C) AdRIP-hHNF4α8-transduced islets at 72-h time point. D, Quantification of the percentage of Pdx1+ cells that are TUNEL+ in each experimental condition 72 h after transduction (n = 3–4 for each group). Immunostaining for HNF4α (green), TUNEL (red), and DAPI (blue) in AdRIP-hHNF4α8-transduced islets at (E) 72-h, and (F) 120-h time points. G, Quantification of the percentage of HNF4High cells that are Tunel+ at 72 and 120 h after transduction (n = 3 per time point). Analysis of TUNEL (red) positive cells that are BrdU+ (green) at (H) 72 h and (I) 120 h after transduction with AdRIP-hHNF4α8. J, Quantification of the percentage of either BrdU+,diffuse or BrdU+,punctate cells that are TUNEL+ at 72 h and 120 h (n = 3–5 per time point). Immunodetection of Nkx6.1 (green), BrdU (red), and DAPI (blue) in HNF4α8 transduced islets (K) 48 h and (L) 120 h after transduction. M, Quantification of the percentage of BrdU+,punctate cells that are Nkx6.1+ at 48 and 120 h (*, P < 0.001; n = 3 per time point). Immunodetection of MafA (green), BrdU (red), and DAPI (blue) in HNF4α8-transduced islets (N) 48 h and (O) 120 h after transduction. P, Quantification of the percentage of BrdU+,punctate cells that are MafA+ at 48 and 120 h (n = 2–3 per time point). The yellow arrows indicate BrdU+,punctate, Nkx6.1−, or MafA− cells, and white arrows highlight their colocalization. The scale bars in panels C, F, H, and O indicate 25 μm. n.s., P = 0.28.

