Fig 1.
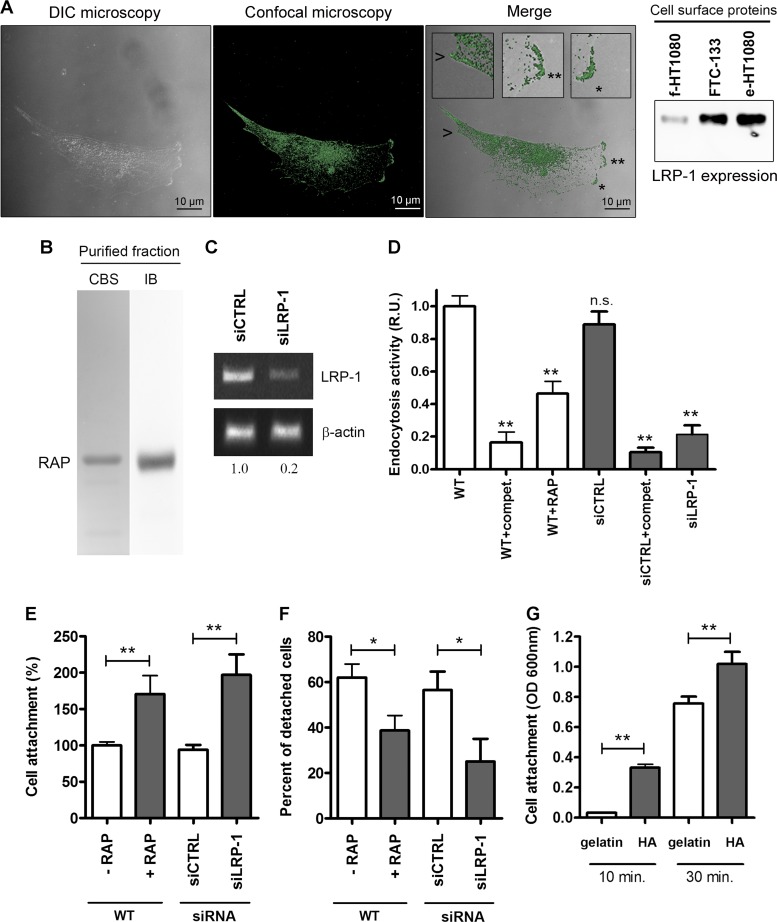
Blockade of LRP-1-mediated endocytosis increases FTC-133 cell attachment. (A) Cell surface expression of LRP-1 was assessed in FTC-133 cells. In the left panel, differential interference contrast (DIC) microscopy was combined with confocal microscopy imaging for LRP-1. In the merged image, insets (zoomed in 300%) highlight cell surface expression of LRP-1 (green) at the leading edge (star and double star) and at the rear of the cell (arrowhead). Bars, 10 μm. In the right panel, cell surface biotinylated proteins were obtained from FTC-133, fibroblastoid HT1080 (f-HT1080), or epithelioid HT1080 (e-HT1080) cells and subjected to immunoblot analysis using anti-LRP-1 antibodies (8G1). (B) Purified HA-tagged RAP was assessed by SDS-PAGE followed by Coomassie blue staining (CBS) and immunoblotting using anti-HA tag antibodies (IB). The gel is shown in its full length. (C) Total RNAs were purified from FTC-133 cells transfected with nonsilencing siRNA (siCTRL) or siRNA targeting LRP-1 (siLRP-1). The transcriptional level of LRP-1 was assessed by RT-PCR, and β-actin primers were used as a normalization control. Numbers under the gel indicate the fold change compared to results for siCTRL cells, used as a reference. (D) Wild-type FTC-133 cells (WT) were treated with RAP (500 nM) or not for 2 h or transfected with siRNA sequences (siCTRL and siLRP-1) and then incubated for 30 min in serum-free medium containing FITC-labeled human α2 M. Endocytosis of nonlabeled ligand was used as a competition experiment (compet.) to ensure the selectivity of the assay. The intracellular fluorescence corresponding to the endocytosis activity was determined as described elsewhere (12) and is expressed as relative units (R.U.), by comparison with signal from WT cells. (E) FTC-133 cells were pretreated with RAP (500 nM) for 24 h or transfected with nonsilencing siRNA (siCTRL) or LRP-1-silencing sequences (siLRP-1). Then, cells were seeded onto gelatin-coated plates, and the nonadherent cells were discarded after 30 min. Results are expressed as percentages of adherent cells compared to WT cells. (F) FTC-133 cells treated or not with RAP (500 nM, 24 h), siRNA control cells (siCTRL), and LRP-1-silenced cells (siLRP-1) were grown in gelatin-coated dishes for 24 h and subjected to trypsinization assay by addition of 0.025% trypsin (wt/vol) for 10 min. Results are expressed as percentages of detached cells. (G) FTC-133 cell adhesion assay was performed on hyaluronic-acid-coated plates (HA) or on gelatin-coated plates for 10 or 30 min. Results are expressed as optical density (OD) measured at 600 nm. Each value is the mean ± SD for at least three independent experiments, each performed in triplicate. n.s., not significant; *, P < 0.05; *∗, P < 0.01.

