Fig 2.
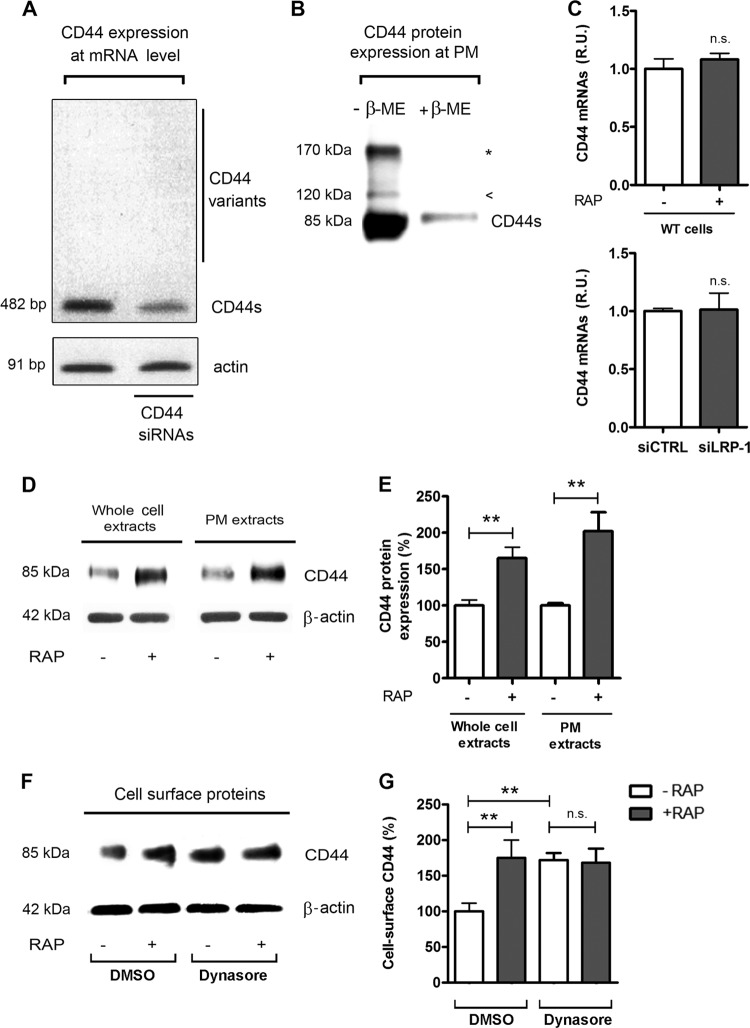
Analysis of CD44 expression in FTC-133 cells in basal conditions and under LRP-1 inhibition. (A) Total RNAs were purified from FTC-133 cells and subjected to RT-PCR using primers for the standard CD44 (CD44s, 482 bp) and the variant isoforms of CD44 (>482 bp). The gel is shown in its full length. siRNA sequences targeting CD44 were used to control the specificity of the band. β-Actin primers were used as a normalization control. (B) CD44 expression at the plasma membrane (PM) was assessed after cell surface biotinylation of proteins at 4°C by SDS-PAGE in the presence or absence of β-mercaptoethanol (β-ME) and immunoblotting of CD44. The 85-kDa band corresponds to the standard CD44 (CD44s); the arrowhead represents the glycosylated form of CD44, and the star indicates the CD44 dimer. (C) Total RNAs were purified from wild-type carcinomas (treated or not with RAP for 24 h) and from siRNA-transfected cells (siCTRL and siLRP-1). CD44 mRNA expression was quantified using real-time RT-PCR and expressed as relative units (R.U.). β-Actin was used for normalization. Nontreated wild-type (WT) and siCTRL cells served as a reference set to 1. (D) Plasma membrane (PM) extracts from cell surface biotinylated proteins or whole-cell extracts were obtained from FTC-133 cells treated or not with RAP (500 nM, 1 h). Immunoblot analysis was performed using anti-CD44 antibodies (A020). The β-actin levels in the whole-cell extract (left) and in the intracellular fraction (right) served as a loading control. (E) Quantification of CD44 expression at the protein level. (F) FTC-133 cells were treated with or without RAP (500 nM, 1 h) and with DMSO or dynasore (120 μM) for 30 min. DMSO served as a control for dynasore treatment. Plasma membrane extracts were subjected to immunoblot analysis for CD44. Expression of β-actin in the corresponding intracellular fraction served as a loading control. (G) Quantification of cell surface CD44. Each value is the mean ± SD for at least three independent experiments. n.s., not significant; *∗, P < 0.01.

