Fig 6.
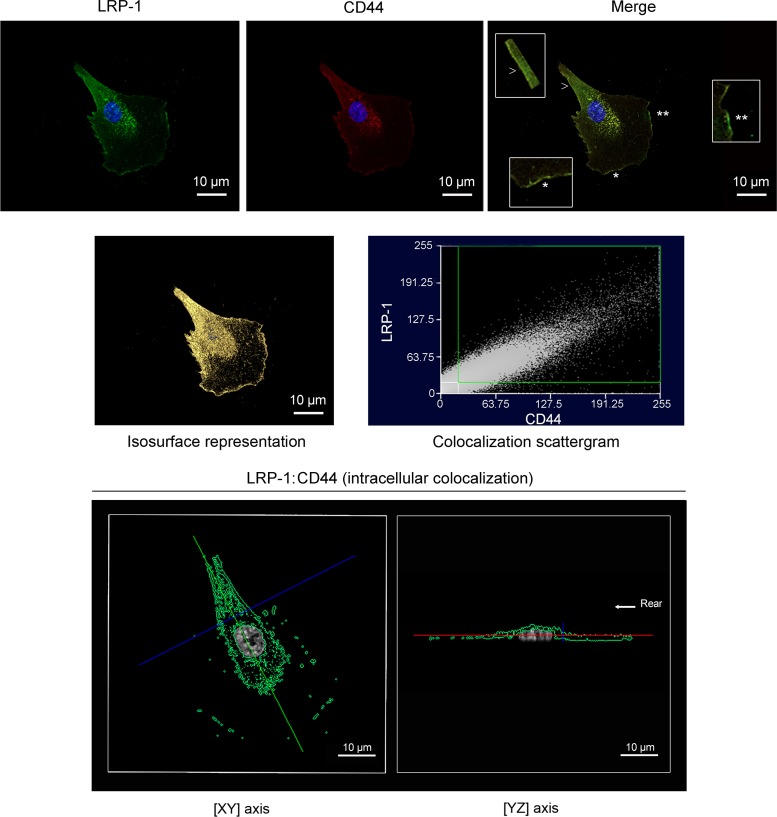
Confocal imaging reveals that LRP-1 and CD44 are colocalized in FTC-133 cells. FTC-133 cells were plated onto gelatin-coated coverslips for 4 h at 37°C, fixed, washed, and stained with Alexa Fluor 488 for LRP-1 (green) and Alexa Fluor 568 for CD44 (red) and analyzed by confocal microscopy. Nuclei were counterstained with diaminido phenylindole (DAPI) (blue). Images were treated with AMIRA software, as indicated in Materials and Methods. In the upper panel, LRP-1 labeling (left), CD44 labeling (middle), and a merged image (right) are shown. In the merged image, insets from the leading edge (star and double star) and the rear of the cell (arrowhead) highlight the colocalization of LRP-1 and CD44 (zoomed in 300%). The middle panel displays the isosurface representation of LRP-1–CD44 colocalization (yellow spots) and the two-dimensional scattergram, used to estimate the degree of LRP-1–CD44 colocalization. The lower panel represents the intracellular colocalization of LRP-1–CD44 (green spots) revealed by one single cross section (xy axis at left; yz axis at right). The rear of the cell is indicated by the arrow. Images are representative of three distinct sets of culture. Bars, 10 μm.

