Fig 3.
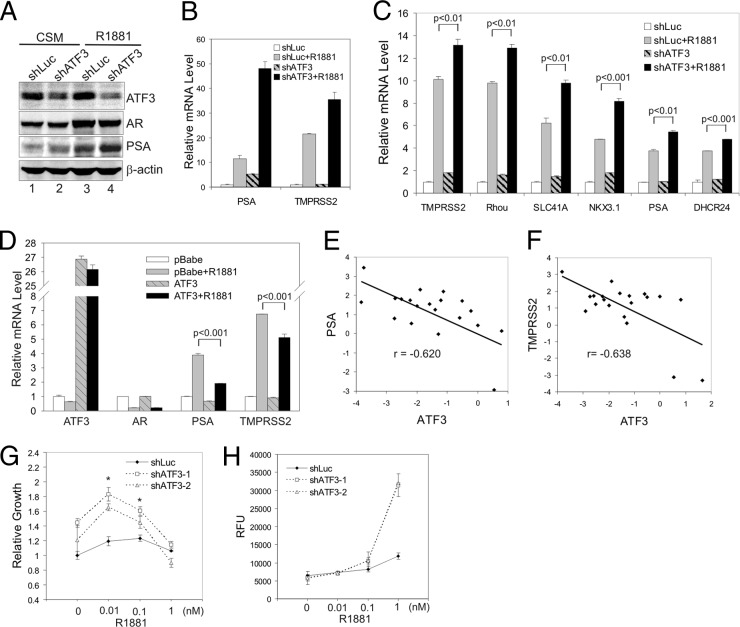
ATF3 represses androgen signaling in prostate cancer cells. (A and B) LNCaP cells were infected with lentiviruses expressing shATF3 or shLuc and selected with puromycin for 4 weeks. A clone stably expressing shATF3 was cultured in CSM for 2 days, treated with 1 nM R1881 for 24 h, and then lysed for Western blotting (A) or qRT-PCR assays (B). Data are depicted as averages ± standard deviations of three determinations. (C) LNCaP cells were infected with shATF3-expressing lentiviruses for 2 days, followed by being cultured in CSM for 2 days and then treated with 1 nM R1881 for 24 h. Cells were lysed for qRT-PCR assays to measure mRNA levels of indicated androgen-dependent genes. Data are depicted as averages ± standard deviations of three determinations. (D) VCaP cells infected with retroviruses expressing ATF3 or empty vector (pBabe) were cultured in CSM for 2 days, followed by treatments with 1 nM R1881 for 1 day. Levels of the indicated mRNAs were measured by qRT-PCR. Data are depicted as averages ± standard deviations of three determinations. (E and F) A qRT-PCR tissue array was used to measure ATF3, PSA, and TMPRSS2 mRNA levels in human prostate cancer samples (n = 20). Relative mRNA levels were converted to logarithms (log2) and plotted for each sample. A linear regression line and Pearson's correlation (r) are shown for each graph. (G) LNCaP cells infected with lentiviruses expressing ATF3-specific shRNA (shATF3-1 and shATF3-2) or shLuc were cultured in CSM for 2 days. Various amounts of R1881 were added on days 0, 3, 6, and 9, and numbers of viable cells were measured on day 10 by MTT [3-(4,5-dimethylthiazol-2-yl)2 2,5-diphenyl tetrazolium bromide] assays. Data are depicted as averages ± standard deviations of three determinations. (H) LNCaP cells expressing shATF3 or shLuc were cultured in CSM for 2 days, followed by treatments with R1881. Levels of cellular lipids were measured by AdipoRed assays. Data are depicted as averages ± standard deviations of three determinations. RFU, relative fluorescence units.

