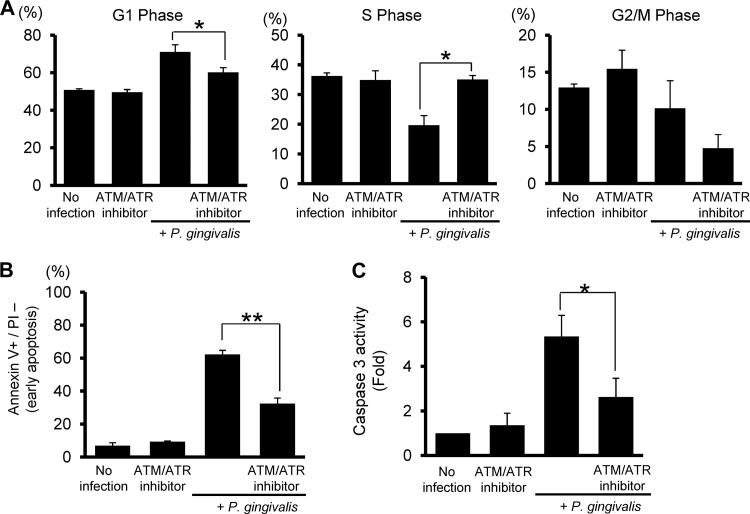
Fig 3.
Effects of an ATM and ATR inhibitor on G1 arrest and apoptosis. HTR-8 cells were infected with P. gingivalis at an MOI of 200 for 48 h. An inhibitor was added for 2 h prior to infection. (A) DNA content was analyzed by flow cytometry, and cell cycle profiles were obtained with ModFit software. Results are means ± standard deviations (SD) of cell cycle distribution from three independent experiments with flow cytometry parameters set to exclude cell debris and aggregates. *, P < 0.05 compared with infected cells without inhibitor (t test). (B) Cells were stained with annexin V and PI and analyzed by flow cytometry. Mean percentage ± SD of apoptotic (annexin V+/PI−) cells. Error bars indicate standard deviation (n = 3). *, P < 0.01 compared with infected cells without inhibitor. (C) Cells were treated with inhibitor were infected with P. gingivalis for 48 h as described for panel B, and caspase 3 activity was measured. Fold changes were calculated relative to infected cells without inhibitor (t test). * and **, P < 0.05 and P < 0.01 (Student's t test) compared with P. gingivalis-infected cells with inhibitor.

