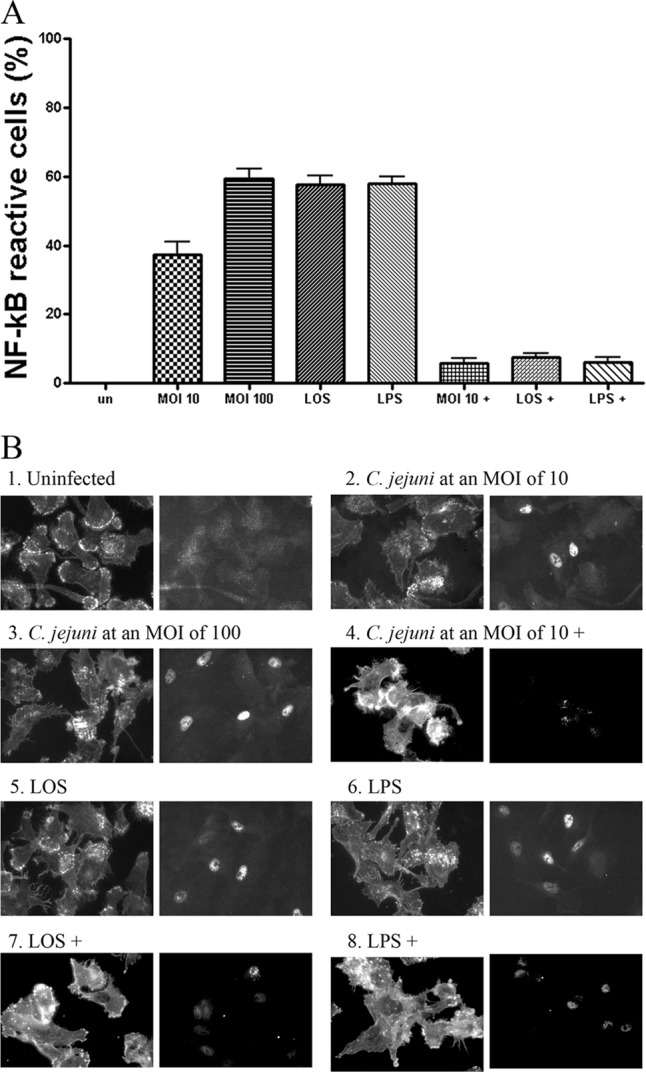
Fig 7.

Indirect immunofluorescence analysis of NF-κB activation in DCs. Dendritic cells were infected with C. jejuni 81-176 or treated with 0.1 μg/ml LOS or LPS for 2 h. Treated DCs were then reacted with NF-κB p65 (L8F6) mouse monoclonal antibody, anti-mouse IgG Fab2 Alexa Flour 488 (green), and Alexa Fluor 594 phalloidin (red). (A) The percentage of the NF-κB reactive DCs with green nuclei is presented. Approximately 100 DCs under each coverslip for each experiment were counted. Data are presented as the means ± SD from 3 independent assays. (B) The fluorescent images labeled by phalloidin (left) and NF-κB antibody (right) are presented: 1, uninfected controls; 2 and 3, DCs infected with C. jejuni 81-176 at MOIs of 10 or 100, respectively; 4, DCs were preincubated with 50 μM CAPE (designated with a plus sign) for 1 h and infected with C. jejuni 81-176 at an MOI of 10; 5, DCs treated with LOS; 6, DCs treated with LPS; 7 and 8, DCs preincubated with 50 μM CAPE for 1 h and treated with LOS or LPS, respectively.
