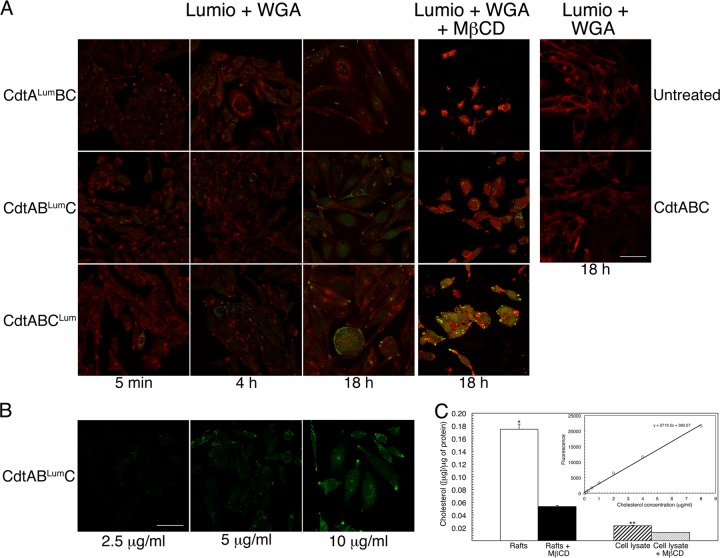
Fig 2.
Localization of the Cdt subunits in intoxicated cells. (A) Cultures of CHO-K1 were treated with 10 μg/ml (120 nM) of heterotrimer reconstituted with each of the subunits, containing tetracysteine and spacer sequences. Cells were labeled with Lumio green (green fluorescence) and WGA-Alexa Fluor 555 (red fluorescence) at 5 min, 4 h, and 18 h postintoxication. Cells were incubated with either no toxin (panel labeled Untreated) or wild-type heterotrimer (panel labeled CdtABC) as controls. In a subset of experiments, CHO-K1 cells were treated with MβCD, immediately prior to intoxication for 18 h, as described in Materials and Methods. Cells were colabeled as described above. The merged images are shown for all experiments. Scale bar = 50 μm. (B) To examine dose response, CHO-K1 cultures were exposed to 2.5, 5, and 10 μg/ml of heterotrimer reconstituted with CdtABLumC for 18 h. The cells were then labeled with Lumio green. Scale bar = 50 μm. (C) Quantification of cholesterol in isolated membrane rafts and total cell lysate before and after treatment with MβCD for 18 h. The results were expressed as μg of cholesterol per 1 μg of total protein in the sample. Statistically significant differences are marked by asterisks (*, P = 0.001; **, P = 0.0002). The cholesterol standard curve is shown in the inset.

