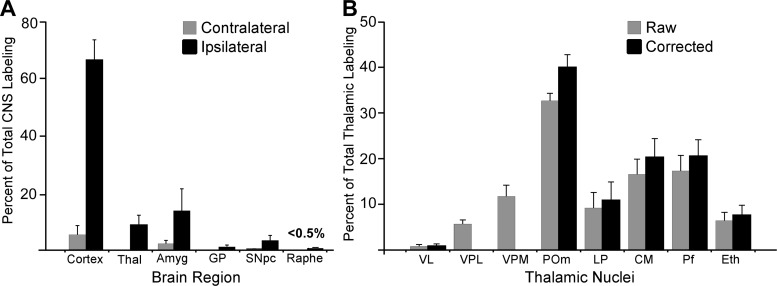
Fig. 10.
Bar histograms illustrating mean proportion of FG-labeled neurons in different brain regions after injecting FG into the DLS of seven rats. A: distribution of cortical and subcortical labeling in the ipsilateral and contralateral hemispheres after reconstructing alternate sections throughout entire brain. B: distribution of labeled neurons in different thalamic nuclei after reconstructing every coronal section through the thalamus. Data are expressed for all plotted neurons (Raw) and after subtracting labeled neurons appearing in VPM and VPL (Corrected). Brackets indicate SE.

