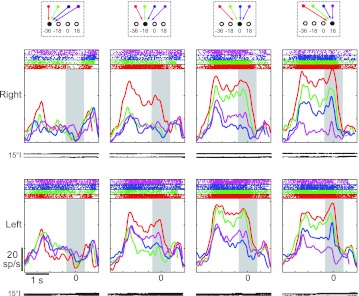
Fig. 3.
Peristimulus time histograms from a single neuron for all targets in both workspaces (right and left, rows). Data are aligned at movement onset. Gray rectangle illustrates the analysis window used in this study. Each column shows responses for a given target location in visual coordinates; colors represent different starting positions. Traces illustrate horizontal (top) and vertical (bottom) eye position traces. Average movement times over all 4 starting positions and targets were 249 ± 106 ms. Average reaction times were 272 ± 100 ms. sp/s, Spikes/s.

