Fig. 1.
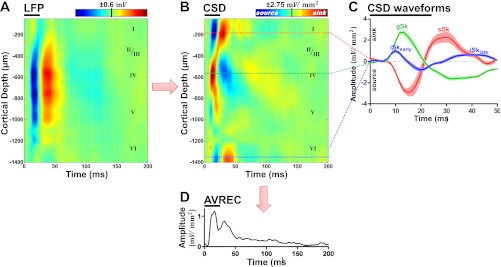
Noise burst evoked local-field potentials (LFPs) and current-source density (CSD) analysis in primary auditory cortex (A1). A: representative LFP profile recorded from electrode spanning the depth of A1 in response to 25-ms noise burst at 70 dB SPL (horizontal black bar) during baseline condition. Depth from the cortical surface is indicated on the left ordinate and approximate cortical layer is indicated on the right ordinate. B: CSD analysis on LFP profile in A. Red and blue coloring indicate current sinks and sources, respectively. C: cross-section waveforms extracted from the CSD profile in B. The supragranular (red), granular (green), and infragranular (blue) responses (mean ± SE; sinks are positive, sources are negative) were selected from the electrode with the peak amplitude within the region (see Fig. 2). Four sinks were identified within the first 50 ms of the response and were labeled: supragranular, sSk; granular, gSk; early infragranular, iSkearly; late infragranular, iSklate. D: averaged rectified current (AVREC) computed from CSD profile in B.

