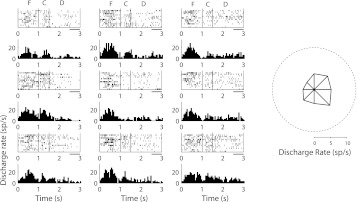
Fig. 3.
Rasters and peristimulus time histograms of a single inverted tuning neuron in the dorsal PFC. Rasters and histograms depict responses in spikes per second (sp/s) for the 9 cue locations, arranged as to indicate the spatial location of the corresponding cue. Responses during the fixation interval (F), cue presentation (C), and delay period (D) are shown. Horizontal bars represent interval of the delay period used to compute inverted tuning. The polar plot on the right denotes the average firing rate during the delay period for each location; the dotted circle represents the average firing rate during the baseline, fixation period.

