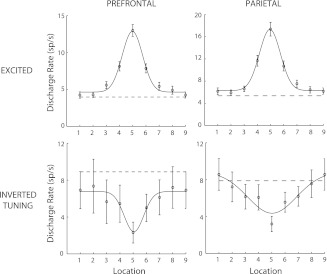
Fig. 6.
Population tuning curves for excited and inverted tuning neurons in the dorsal PFC and PPC. The arrangement of spatial locations has been rotated so that the best response is at location 5 for every neuron; points 1 and 9 represent the same location. Curve represents best Gaussian fit and dotted line the average firing rate in the baseline fixation period. Error bars represent SEs across neurons.

