Fig. 2.
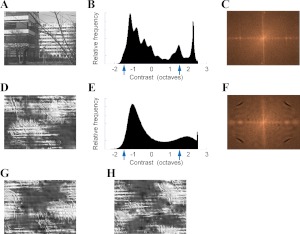
Background images used to assess the importance of naturalness in response modulation. A: natural image scene taken from the van Hateren database (van Hateren and van der Schaaf 1998). B: luminance histogram of image in A; arrows show the contrasts of the stimulus bars used to probe the response of the RF, either 50% above or below the mean luminance level of the image. C: normalized power spectrum of the original image; brighter indicates greater energy. Horizontal axis corresponds to horizontal spatial frequencies increasing from the center to the left and right borders. Vertical axis corresponds to vertical frequencies. Center corresponds to zero spatial frequency. D: synthetic “unnatural” image derived from the image in A with the texture-synthesis algorithm of Portilla and Simoncelli (2000). E: luminance histogram of the synthetic image in D. F: power spectrum of the synthetic image in D. G and H: 2 other “unnatural” images synthesized from A, with different initial seeds. The luminance histograms of the images in G and H are identical to E; their power spectra is identical to F.

