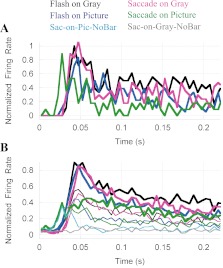
Fig. 5.
A subpopulation of neurons had an unusual early response in the Sac-on-Pic condition (green). A: single cell example showing an early response in the Sac-on-Pic condition. B: average response of 7 cells that showed an early component in the Sac-on Pic condition. Color code as in Figs. 1 and 4; thick lines show optimal-orientation responses, thin lines show responses to bars tilted 60° counterclockwise from optimal. The thin gray trace is the response in the Sac-on-Gray-NoBar condition, and the thin cyan trace is the response in the Sac-on-Pic-NoBar condition. The Sac-on-Pic responses (green, thick and thin traces) show an early increase of activity between 10 and 30 ms. The early response in the Sac-on-Pic-NoBar condition (cyan) is nearly identical in that period, suggesting that the early activity is due to visual stimulation during the saccade rather than afterward.

