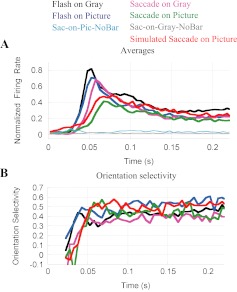
Fig. 6.
Responses in simulated saccade conditions are similar to responses with real saccades. A: average response of 42 cells to an optimally oriented bar of light in the 4 principal conditions (color code as in Figs. 1 and 4). The response in the simulated-saccade condition (red trace) is largely similar to the response with a real saccade on a complex scene (green). However, with real saccades the response amplitude is lower. B: orientation selectivity in the Simulated-Saccade condition (red) follows a pattern similar to the Sac-on-Picture condition (green).

