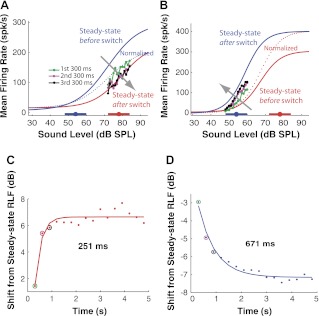
Fig. 4.
Time course of dynamic range shift in the AN. The AN fiber shown in A and C has its CF at 4.9 kHz and its spontaneous firing rate at 25.6 spk/s, whereas the fiber shown in B and D has its CF at 592 Hz and its spontaneous firing rate at 8.7 spk/s. A: evolution of RLFs with time for upward switches with HPR changing from 54 to 78 dB SPL in an AN fiber. Fitted data are represented as follows: blue line, steady-state RLF before the switch; red line, steady-state RLF after the switch; dotted blue line, pre-switch steady-state RLF (blue line) normalized to post-switch steady-state RLF (red line). Raw data are represented as follows: green line/dots, averaged HPR-region RLF for the high HPR levels of the first 300-ms epoch after the switch; magenta line/dots, HPR-region RLF of the second 300-ms after the switch; black line/dots, HPR-region RLF of the third 300-ms epoch. Fitted straight lines to the HPR-region RLF are not shown. Thick horizontal bars with filled circles along the x-axis denote the HPRs and their mean levels, respectively. The gray arrow indicates the direction of RLF evolution with time. B: same as in A but for downward switches from 78 to 54 dB SPL in a different AN fiber. C: horizontal shift of the RLF with time from the normalized steady-state RLF before the switch for consecutive 300-ms epochs for upward switches. Dots represent raw data (color-coded circles designate the results for the first three 300-ms epochs); line is fitted single exponential. The time constant is 251 ms. D: same as C but for the downward switch shown in B in which the shift has a negative sign, indicating the shift direction is opposite that for upward switches. The time constant is 671 ms.

