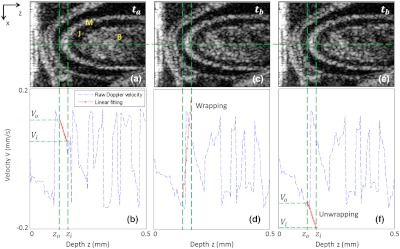
Fig. 4.
Depth-dependent Doppler velocity profiles (bottom row) along the central lines of the corresponding structural cross-sections shown in top row. Top and bottom are paired figures with the top showing the cross-sectional OCT images, and the bottom giving the corresponding velocity profiles across the central A-lines marked as horizontal dashed lines in the top row. Vertical dashed lines are defined by the boundaries of the cardiac wall, facilitating the localization of the velocity profiles that correspond to the wall (, and corresponding , ); (b) shows the case that the wall motion is within the detectable range of the system; (d) illustrates the wall motion is outside the detectable range, thus phase un-wrapping algorithm is used to correct the OCT so that the correct velocity profile can be obtained, the result of which is given in (f).

